
FIGURE
Fig. 4
- ID
- ZDB-FIG-080715-40
- Publication
- Park et al., 2008 - Molecular cloning and expression analysis of the STAT1 gene from olive flounder, Paralichthys olivaceus
- Other Figures
- All Figure Page
- Back to All Figure Page
Fig. 4
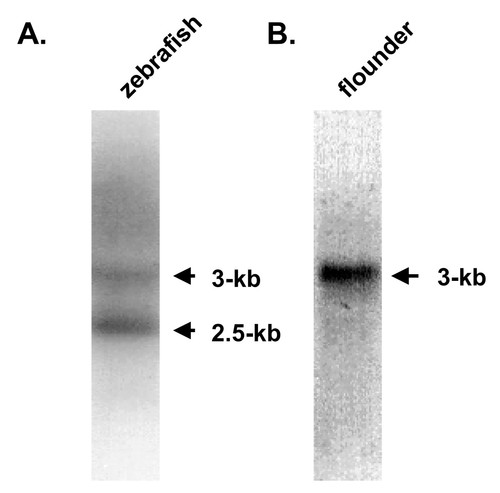
Northern blot analysis of flounder STAT1. (A) Zebrafish mRNA was used as a positive control that showed STAT1 (upper band) and STAT3 (lower band) mRNA. (B) Flounder mRNA detected with a flounder STAT1 SH2 domain-specific probe. |
Expression Data
Expression Detail
Antibody Labeling
Phenotype Data
Phenotype Detail
Acknowledgments
This image is the copyrighted work of the attributed author or publisher, and
ZFIN has permission only to display this image to its users.
Additional permissions should be obtained from the applicable author or publisher of the image.
Open Access.
Full text @ BMC Immunol.