
Fig. 4
- ID
- ZDB-FIG-080620-4
- Publication
- Peterson et al., 2000 - Small molecule developmental screens reveal the logic and timing of vertebrate development
- Other Figures
- All Figure Page
- Back to All Figure Page
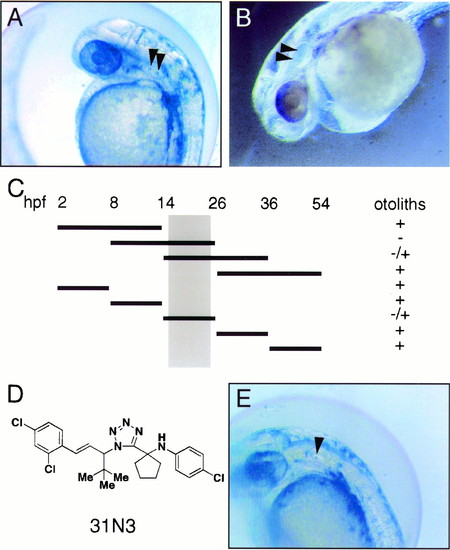
The small molecule 31N3 alters ear development between 14 and 26 hpf. (A) Untreated zebrafish embryo photographed 36 hpf. The two otoliths are indicated with arrowheads. (B) Embryo treated with 31N3 from 2 to 36 hpf and then photographed. The expected locations of the two otoliths are indicated by arrowheads. (C) Embryos were treated with 31N3 at a concentration of 2 μg/ml during the times indicated by black bars, after which the embryos were transferred to fresh fish water. The presence of otoliths was scored at 54 hpf. (D) The structure of the small molecule 31N3. The olefin is trans as confirmed by nuclear magnetic resonance, coupling constant 15.6 Hz. (E) Embryo treated with 31N3 from 14 to 26 hpf and then allowed to develop in the absence of 31N3 until 36 hpf. The embryo was photographed 36 hpf. The single otolith is indicated by an arrowhead. |