
FIGURE
Fig. 11
Fig. 11
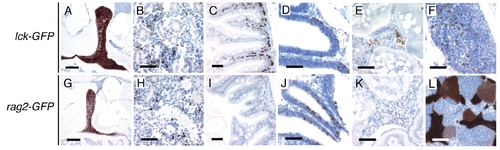
Anti-GFP immunostaining of sectioned lck-GFP and rag2-GFP transgenic fish. (A–F) lck-GFP. (G–L) rag2-GFP. Thymus (A and G), kidney (B and H), intestinal lining (C and I), nasal epithelium (D and J), ovary (E and K), spleen (F), and testes (L) are shown. [Scale bars, 100 μm (A and G) and 20 μm (B–F and H–L).] |
Expression Data
Expression Detail
Antibody Labeling
Phenotype Data
Phenotype Detail
Acknowledgments
This image is the copyrighted work of the attributed author or publisher, and
ZFIN has permission only to display this image to its users.
Additional permissions should be obtained from the applicable author or publisher of the image.
Full text @ Proc. Natl. Acad. Sci. USA