
Fig. 4
- ID
- ZDB-FIG-080326-56
- Publication
- Hegde et al., 2008 - Genomewide Expression Analysis in Zebrafish mind bomb Alleles with Pancreas Defects of Different Severity Identifies Putative Notch Responsive Genes
- Other Figures
- All Figure Page
- Back to All Figure Page
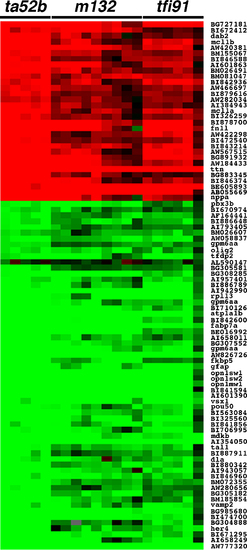
Gene expression profile of 91 differentially expressed (q = 0.0, score(d)>4.0) genes (Genbank ID) common to all three mib mutant alleles at 72 hpf. At least two biological repeats and two technical repeats were carried out for each mutant allele. Each horizontal strip represents expression of a single gene. Color in each cell reflects the expression level of corresponding gene in the respective sample. The up-regulation is shown in red and the down-regulation in green. Grey cells indicate the missing values. The median log2 ratio values for differential expression ranged between -4.07 and 3.32. Note: The gene symbols are mentioned instead of Genbank IDs, where the gene symbols corresponding to the Genbank IDs are available in the Zebrafish Chip Annotation Database. Three Genbank IDs, BI840762, BI839927 and BG306150, encode the same gene, gpm6aa. |