
Fig. 2
- ID
- ZDB-FIG-070822-63
- Publication
- Schoenebeck et al., 2007 - Vessel and blood specification override cardiac potential in anterior mesoderm
- Other Figures
- All Figure Page
- Back to All Figure Page
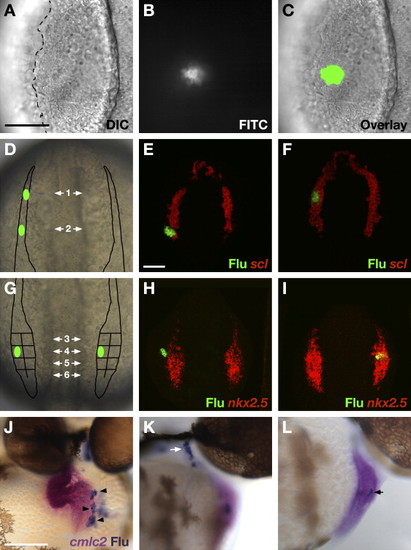
Constructing a Fate Map of ALPM Territories (A–I) Dorsal views, anterior to the top, of wild-type embryos at the 6–9 somite stage. The scale bars represent 100 μm. (A–C) Photoactivation of caged fluorescein labels groups of cells in the ALPM. (A) DIC image of a live embryo. The lateral edge of the ALPM (dashed line) is visible. (B) Fluorescence indicates photoactivation of caged fluorescein. (C) Overlay of DIC and fluorescent images confirms location of labeled cells. In this example, the ∼14 labeled cells reside in the medial ALPM. (D and G) Schematics indicate ALPM regions that were interrogated by fate mapping. (D) Two regions within the rostral ALPM were examined, on both sides of the embryo: a region flanking the forebrain (region 1) and a region flanking the midbrain-hindbrain boundary (region 2). (E and F) Examples of control experiments performed to assess the accuracy of labeling rostral ALPM. Cells were labeled in the regions depicted by green ovals in (D) and immediately processed to compare scl expression (red) relative to uncaged fluorescein (green). (E) Cells labeled in region 2 were located solely within the scl expression domain in 5/9 experiments; in the other four experiments, labeling crossed the posterior border of scl expression and therefore overlapped with hand2-expressing territory. (F) Cells labeled in region 1 were located within the scl expression domain in 8/8 experiments. (G) Eight regions within the caudal ALPM were examined, on both sides of the embryo: four medial regions and four lateral regions are distinguished by their position along the anterior-posterior axis. (H and I) Examples of control experiments performed to assess mediolateral labeling accuracy. Cells were labeled in the regions depicted by green ovals in (D) and immediately processed to compare nkx2.5 expression (red) relative to uncaged fluorescein (green). (H) Cells labeled in lateral regions did not express nkx2.5 (n = 8/9). (I) Conversely, cells labeled in medial regions did express nkx2.5 (n = 6/6). (J–L) Scoring progeny of labeled ALPM cells at 44 hpf. In situ hybridization indicates expression of cmlc2 (magenta) in cardiomyocytes, and immunohistochemistry for uncaged fluorescein (blue) indicates progeny of labeled cells. The scale bar represents 100 μm. (J) Frontal view, dorsal to the top; in this example, labeled cells became ∼30 atrial cardiomyocytes (black arrowheads). (K and L) Lateral views, anterior to the right. (K) In this example, 30–40 labeled cells populated a pharyngeal pouch (white arrow). (L) In this example, 3–4 labeled cells (black arrow) contributed to the ventricular endocardium. |
| Gene: | |
|---|---|
| Fish: | |
| Anatomical Term: | |
| Stage: | High-pec |
Reprinted from Developmental Cell, 13(2), Schoenebeck, J.J., Keegan, B.R., and Yelon, D., Vessel and blood specification override cardiac potential in anterior mesoderm, 254-267, Copyright (2007) with permission from Elsevier. Full text @ Dev. Cell