|
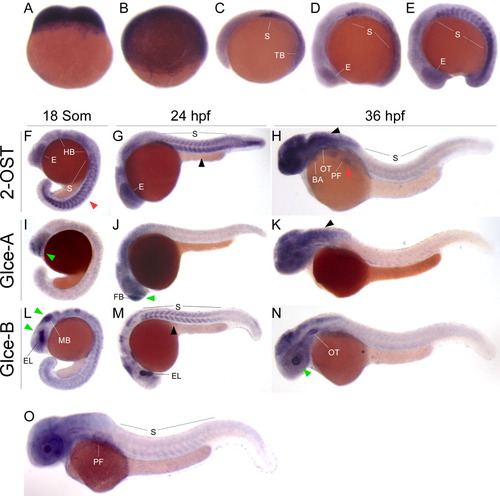
Expression of heparan sulfate (HS) 2-O-sulfotransferase (2-OST) and Glce-A and -B are not always coordinated during early zebrafish development. A-E: Early expression of HS 2-OST in two cell (A), 60% epiboly (B), 2 somite (C), 7 somite (D), and 13 somite (E) stages. F-N: Comparison of HS 2-OST (18 somites, F; 24 hr postfertilization [hpf], G; and 36 hpf, H), C5-epimerase-A (18 somites, I; 24 hpf, J; and 36 hpf, K), and C5-epimerase-B (18 somites, L; 24 hpf, M; and 36 hpf, N). Green arrows indicate areas where expression is stronger or unique to the C5-epimerase genes, black arrows represent areas where expression is similar between 2-OST and epimerase, and red arrows indicate areas where 2-OST is stronger. O: Expression of HS 2-OST at 48 hpf. BA, branchial arches; E, eye; EL, eye lens; FB, forebrain; HB, hindbrain; MB, midbrain; OT, otic vesicle; PF, pectoral fin; S, somites; TB, tail bud.
|