
Fig. 6
- ID
- ZDB-FIG-060901-6
- Publication
- Li et al., 2006 - The transcription factor ZBP-89 controls generation of the hematopoietic lineage in zebrafish and mouse embryonic stem cells
- Other Figures
- All Figure Page
- Back to All Figure Page
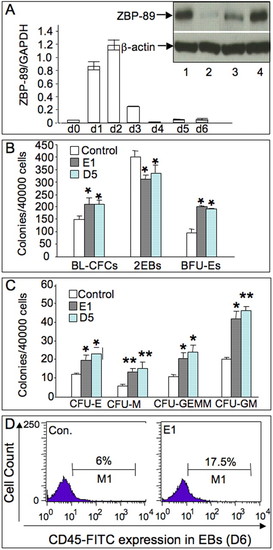
Expression profile of ZBP-89 and effects of its overexpression on hematopoiesis in mouse EB cultures. (A) ZBP-89 expression profile in undifferentiated ESCs and differentiating EBs quantified with real-time PCR. Numbers indicate the day of differentiation. Results represent mean±s.d. of three independent experiments. Inset, western blot analysis showing induction of the ZBP-89 protein mainly in FLK1+ mesoderm precursors in day 3 EBs. Lane 1, positive control; lane 2, uninduced ESCs; lane 3, day 3 FLK1- mesodermal cells; lane 4, FLK1+ mesoderm precursors. Equivalent amounts of cell lysate were loaded per lane as reflected by the β-actin signal. (B) Histograms showing the number of blasts (BL-CFCs), secondary EBs (2°EBs) and primitive erythroid (BFU-Es) colonies generated from control, D5 and E1 clones (bars represent the mean number of colonies±s.d. from two independent experiments). (C) Histograms (mean±s.d., n=3) showing the numbers of definitive erythroid (CFU-E), macrophage (CFU-M), granulocyte-macrophage-megakaryocyte (CFU-GEMM) and granulocyte-macrophage (CFU-GM) colonies. *P<0.01; **P<0.001 (paired t-test). (D) Flow cytometric analysis of a single-cell suspension from E1-derived EBs (see Materials and methods) stained with FITC-labeled rat antimouse CD45 monoclonal antibody. ZBP-89 overexpression significantly increased the number of CD45+ hematopoietic progenitors. |