
FIGURE
Fig. 4
- ID
- ZDB-FIG-060130-766
- Publication
- Thisse et al., 2005 - High Throughput Expression Analysis of ZF-Models Consortium Clones
- Other Figures
-
- Fig. 1
- Fig. 1
- Fig. 1
- Fig. 1
- Fig. 1
- Fig. 1
- Fig. 1
- Fig. 1
- Fig. 1
- Fig. 1
- Fig. 1
- Fig. 1
- Fig. 1
- Fig. 1
- Fig. 1
- Fig. 1
- Fig. 1
- Fig. 1
- Fig. 1
- Fig. 1
- Fig. 1
- Fig. 1
- Fig. 1
- Fig. 1
- Fig. 1
- Fig. 1
- Fig. 1
- Fig. 1
- Fig. 1
- Fig. 1
- Fig. 1
- Fig. 1
- Fig. 1
- Fig. 1
- Fig. 1
- Fig. 1
- Fig. 1
- Fig. 1
- Fig. 1
- Fig. 1
- Fig. 1
- Fig. 1
- Fig. 1
- Fig. 1
- Fig. 1
- Fig. 1
- Fig. 1
- Fig. 1
- Fig. 1
- Fig. 1
- Fig. 1
- Fig. 1
- Fig. 1
- Fig. 1
- Fig. 1
- Fig. 1
- Fig. 1
- Fig. 1
- Fig. 1
- Fig. 1
- Fig. 1
- Fig. 1
- Fig. 1
- Fig. 1
- Fig. 1
- Fig. 1
- Fig. 1
- Fig. 1
- Fig. 1
- Fig. 1
- Fig. 1
- Fig. 1
- Fig. 1
- Fig. 1
- Fig. 1
- Fig. 1
- Fig. 1
- Fig. 1
- Fig. 1
- Fig. 1
- Fig. 1
- Fig. 1
- Fig. 1
- Fig. 1
- Fig. 1
- Fig. 1
- Fig. 1
- Fig. 1
- Fig. 1
- Fig. 1
- Fig. 1
- Fig. 1
- Fig. 1
- Fig. 1
- Fig. 1
- Fig. 1
- Fig. 1
- Fig. 1
- Fig. 1
- Fig. 1
- Fig. 1
- Fig. 1
- Fig. 1
- Fig. 1
- Fig. 1
- Fig. 1
- Fig. 1
- Fig. 1
- Fig. 1
- Fig. 1
- Fig. 1
- Fig. 1
- Fig. 1
- Fig. 1
- Fig. 1
- Fig. 1
- Fig. 1
- Fig. 1
- Fig. 1
- Fig. 1
- Fig. 1
- Fig. 1
- Fig. 1
- Fig. 1
- Fig. 1
- Fig. 1
- Fig. 1
- Fig. 1
- Fig. 1
- Fig. 1
- Fig. 1
- Fig. 1
- Fig. 1
- Fig. 1
- Fig. 1
- Fig. 1
- Fig. 1
- Fig. 1
- Fig. 1
- Fig. 1
- Fig. 1
- Fig. 1
- Fig. 1
- Fig. 1
- Fig. 1
- Fig. 1
- Fig. 1
- Fig. 1
- Fig. 1
- Fig. 1
- Fig. 1
- Fig. 1
- Fig. 1
- Fig. 1
- Fig. 1
- Fig. 1
- Fig. 1
- Fig. 1
- Fig. 1
- Fig. 1
- Fig. 1
- Fig. 1
- Fig. 1
- Fig. 1
- Fig. 1
- Fig. 1
- Fig. 1
- Fig. 1
- Fig. 1
- Fig. 1
- Fig. 1
- Fig. 1
- Fig. 1
- Fig. 1
- Fig. 1
- Fig. 1
- Fig. 1
- Fig. 1
- Fig. 1
- Fig. 1
- Fig. 1
- Fig. 1
- Fig. 1
- Fig. 1
- Fig. 1
- Fig. 1
- Fig. 1
- Fig. 1
- Fig. 1
- Fig. 1
- Fig. 1
- Fig. 1
- Fig. 1
- Fig. 1
- Fig. 1
- Fig. 1
- Fig. 1
- Fig. 1
- Fig. 1
- Fig. 1
- Fig. 1
- Fig. 1
- Fig. 1
- Fig. 1
- Fig. 1
- Fig. 1
- Fig. 1
- Fig. 1
- Fig. 1
- Fig. 1
- Fig. 1
- Fig. 1
- Fig. 1
- Fig. 1
- Fig. 1
- Fig. 1
- Fig. 1
- Fig. 1
- Fig. 1
- Fig. 1
- Fig. 1
- Fig. 1
- Fig. 1
- Fig. 1
- Fig. 1
- Fig. 1
- Fig. 1
- Fig. 1
- Fig. 1
- Fig. 1
- Fig. 1
- Fig. 1
- Fig. 1
- Fig. 1
- Fig. 1
- Fig. 1
- Fig. 1
- Fig. 1
- Fig. 1
- Fig. 1
- Fig. 1
- Fig. 1
- Fig. 1
- Fig. 1
- Fig. 1
- Fig. 1
- Fig. 1
- Fig. 1
- Fig. 1
- Fig. 1
- Fig. 1
- Fig. 1
- Fig. 1
- Fig. 1
- Fig. 1
- Fig. 1
- Fig. 1
- Fig. 1
- Fig. 1
- Fig. 1
- Fig. 1
- Fig. 1
- Fig. 1
- Fig. 1
- Fig. 1
- Fig. 1
- Fig. 1
- Fig. 1
- Fig. 1
- Fig. 1
- Fig. 1
- Fig. 1
- Fig. 1
- Fig. 1
- Fig. 1
- Fig. 1
- Fig. 1
- Fig. 1
- Fig. 1
- Fig. 1
- Fig. 1
- Fig. 1
- Fig. 1
- Fig. 1
- Fig. 1
- Fig. 1
- Fig. 1
- Fig. 1
- Fig. 1
- Fig. 1
- Fig. 1
- Fig. 1
- Fig. 1
- Fig. 1
- Fig. 1
- Fig. 1
- Fig. 1
- Fig. 1
- Fig. 1
- Fig. 1
- Fig. 1
- Fig. 1
- Fig. 1
- Fig. 1
- Fig. 1
- Fig. 1
- Fig. 1
- Fig. 1
- Fig. 1
- Fig. 1
- Fig. 1
- Fig. 1
- Fig. 1
- Fig. 1
- Fig. 1
- Fig. 1
- Fig. 1
- Fig. 1
- Fig. 1
- Fig. 1
- Fig. 1
- Fig. 1
- Fig. 1
- Fig. 1
- Fig. 1
- Fig. 1
- Fig. 1
- Fig. 1
- Fig. 1
- Fig. 1
- Fig. 1
- Fig. 1
- Fig. 1
- Fig. 1
- Fig. 1
- Fig. 1
- Fig. 1
- Fig. 1
- Fig. 1
- Fig. 1
- Fig. 1
- Fig. 1
- Fig. 1
- Fig. 1
- Fig. 1
- Fig. 1
- Fig. 1
- Fig. 1
- Fig. 1
- Fig. 1
- Fig. 1
- Fig. 1
- Fig. 1
- Fig. 1
- Fig. 1
- Fig. 1
- Fig. 1
- Fig. 1
- Fig. 1
- Fig. 1
- Fig. 1
- Fig. 1
- Fig. 1
- Fig. 1
- Fig. 1
- Fig. 1
- Fig. 1
- Fig. 1
- Fig. 1
- Fig. 1
- Fig. 1
- Fig. 1
- Fig. 1
- Fig. 1
- Fig. 1
- Fig. 1
- Fig. 1
- Fig. 1
- Fig. 1
- Fig. 1
- Fig. 1
- Fig. 1
- Fig. 1
- Fig. 1
- Fig. 1
- Fig. 1
- Fig. 1
- Fig. 1
- Fig. 1
- Fig. 1
- Fig. 1
- Fig. 1
- Fig. 1
- Fig. 1
- Fig. 1
- Fig. 1
- Fig. 1
- Fig. 1
- Fig. 1
- Fig. 1
- Fig. 1
- Fig. 1
- Fig. 1
- Fig. 1
- Fig. 1
- Fig. 1
- Fig. 1
- Fig. 1
- Fig. 1
- Fig. 1
- Fig. 1
- Fig. 1
- Fig. 1
- Fig. 1
- Fig. 1
- Fig. 1
- Fig. 1
- Fig. 1
- Fig. 1
- Fig. 1
- Fig. 1
- Fig. 1
- Fig. 1
- Fig. 1
- Fig. 1
- Fig. 1
- Fig. 1
- Fig. 1
- Fig. 1
- Fig. 1
- Fig. 1
- Fig. 1
- Fig. 1
- Fig. 1
- Fig. 1
- Fig. 1
- Fig. 1
- Fig. 1
- Fig. 1
- Fig. 1
- Fig. 1
- Fig. 1
- Fig. 1
- Fig. 1
- Fig. 1
- Fig. 1
- Fig. 1
- Fig. 1
- Fig. 1
- Fig. 1
- Fig. 1
- Fig. 1
- Fig. 1
- Fig. 1
- Fig. 1
- Fig. 1
- Fig. 1
- Fig. 1
- Fig. 1
- Fig. 1
- Fig. 1
- Fig. 1
- Fig. 1
- Fig. 1
- Fig. 1
- Fig. 1
- Fig. 1
- Fig. 1
- Fig. 1
- Fig. 1
- Fig. 1
- Fig. 1
- Fig. 1
- Fig. 1
- Fig. 1
- Fig. 1
- Fig. 1
- Fig. 1
- Fig. 1
- Fig. 1
- Fig. 1
- Fig. 1
- Fig. 1
- Fig. 1
- Fig. 1
- Fig. 1
- Fig. 1
- Fig. 1
- Fig. 1
- Fig. 1
- Fig. 1
- Fig. 1
- Fig. 1
- Fig. 1
- Fig. 1
- Fig. 1
- Fig. 1
- Fig. 1
- Fig. 1
- Fig. 1
- Fig. 1
- Fig. 1
- Fig. 1
- Fig. 1
- Fig. 1
- Fig. 1
- Fig. 1
- Fig. 1
- Fig. 1
- Fig. 1
- Fig. 1
- Fig. 1
- Fig. 1
- Fig. 1
- Fig. 1
- Fig. 1
- Fig. 1
- Fig. 1
- Fig. 1
- Fig. 1
- Fig. 1
- Fig. 1
- Fig. 1
- Fig. 1
- Fig. 1
- Fig. 1
- Fig. 1
- Fig. 1
- Fig. 1
- Fig. 1
- Fig. 1
- Fig. 1
- Fig. 1
- Fig. 1
- Fig. 1
- Fig. 1
- Fig. 1
- Fig. 1
- Fig. 1
- Fig. 1
- Fig. 1
- Fig. 1
- Fig. 1
- Fig. 1
- Fig. 1
- Fig. 1
- Fig. 1
- Fig. 1
- Fig. 1
- Fig. 1
- Fig. 1
- Fig. 1
- Fig. 1
- Fig. 1
- Fig. 1
- Fig. 1
- Fig. 1
- Fig. 1
- Fig. 1
- Fig. 1
- Fig. 1
- Fig. 1
- Fig. 1
- Fig. 1
- Fig. 1
- Fig. 1
- Fig. 1
- Fig. 1
- Fig. 1
- Fig. 1
- Fig. 1
- Fig. 1
- Fig. 1
- Fig. 1
- Fig. 1
- Fig. 1
- Fig. 1
- Fig. 1
- Fig. 1
- Fig. 1
- Fig. 1
- Fig. 1
- Fig. 1
- Fig. 1
- Fig. 1
- Fig. 1
- Fig. 1
- Fig. 1
- Fig. 1
- Fig. 1
- Fig. 1
- Fig. 1
- Fig. 1
- Fig. 1
- Fig. 1
- Fig. 1
- Fig. 1
- Fig. 1
- Fig. 1
- Fig. 1
- Fig. 1
- Fig. 1
- Fig. 1
- Fig. 1
- Fig. 1
- Fig. 1
- Fig. 1
- Fig. 1
- Fig. 1
- Fig. 1
- Fig. 1
- Fig. 1
- Fig. 1
- Fig. 1
- Fig. 1
- Fig. 1
- Fig. 1
- Fig. 1
- Fig. 1
- Fig. 1
- Fig. 1
- Fig. 1
- Fig. 1
- Fig. 1
- Fig. 1
- Fig. 1
- Fig. 1
- Fig. 1
- Fig. 1
- Fig. 1
- Fig. 1
- Fig. 1
- Fig. 1
- Fig. 1
- Fig. 1
- Fig. 1
- Fig. 1
- Fig. 1
- Fig. 1
- Fig. 1
- Fig. 1
- Fig. 1
- Fig. 1
- Fig. 1
- Fig. 1
- Fig. 1
- Fig. 1
- Fig. 1
- Fig. 1
- Fig. 1
- Fig. 1
- Fig. 1
- Fig. 1
- Fig. 1
- Fig. 1
- Fig. 1
- Fig. 1
- Fig. 1
- Fig. 1
- Fig. 1
- Fig. 1
- Fig. 1
- Fig. 1
- Fig. 1
- Fig. 1
- Fig. 1
- Fig. 1
- Fig. 1
- Fig. 1
- Fig. 1
- Fig. 1
- Fig. 1
- Fig. 1
- Fig. 1
- Fig. 1
- Fig. 1
- Fig. 1
- Fig. 1
- Fig. 1
- Fig. 1
- Fig. 1
- Fig. 1
- Fig. 1
- Fig. 1
- Fig. 1
- Fig. 1
- Fig. 1
- Fig. 1
- Fig. 1
- Fig. 1
- Fig. 1
- Fig. 1
- Fig. 1
- Fig. 1
- Fig. 1
- Fig. 1
- Fig. 1
- Fig. 1
- Fig. 1
- Fig. 1
- Fig. 1
- Fig. 1
- Fig. 1
- Fig. 1
- Fig. 1
- Fig. 1
- Fig. 1
- Fig. 1
- Fig. 1
- Fig. 1
- Fig. 1
- Fig. 1
- Fig. 1
- Fig. 1
- Fig. 1
- Fig. 1
- Fig. 1
- Fig. 1
- Fig. 1
- Fig. 1
- Fig. 1
- Fig. 1
- Fig. 1
- Fig. 1
- Fig. 1
- Fig. 1
- Fig. 1
- Fig. 1
- Fig. 1
- Fig. 1
- Fig. 1
- Fig. 1
- Fig. 1
- Fig. 1
- Fig. 1
- Fig. 1
- Fig. 1
- Fig. 1
- Fig. 1
- Fig. 1
- Fig. 1
- Fig. 1
- Fig. 1
- Fig. 1
- Fig. 1
- Fig. 1
- Fig. 1
- Fig. 1
- Fig. 1
- Fig. 1
- Fig. 1
- Fig. 1
- Fig. 1
- Fig. 1
- Fig. 1
- Fig. 1
- Fig. 1
- Fig. 1
- Fig. 1
- Fig. 1
- Fig. 1
- Fig. 1
- Fig. 1
- Fig. 1
- Fig. 1
- Fig. 1
- Fig. 1
- Fig. 1
- Fig. 1
- Fig. 1
- Fig. 1
- Fig. 1
- Fig. 1
- Fig. 1
- Fig. 1
- Fig. 1
- Fig. 1
- Fig. 1
- Fig. 1
- Fig. 1
- Fig. 1
- Fig. 1
- Fig. 1
- Fig. 1
- Fig. 1
- Fig. 1
- Fig. 1
- Fig. 1
- Fig. 1
- Fig. 1
- Fig. 1
- Fig. 1
- Fig. 1
- Fig. 1
- Fig. 1
- Fig. 1
- Fig. 1
- Fig. 1
- Fig. 1
- Fig. 1
- Fig. 1
- Fig. 1
- Fig. 1
- Fig. 1
- Fig. 1
- Fig. 1
- Fig. 1
- Fig. 1
- Fig. 1
- Fig. 1
- Fig. 1
- Fig. 1
- Fig. 1
- Fig. 1
- Fig. 1
- Fig. 1
- Fig. 1
- Fig. 1
- Fig. 1
- Fig. 1
- Fig. 1
- Fig. 1
- Fig. 1
- Fig. 1
- Fig. 1
- Fig. 1
- Fig. 1
- Fig. 1
- Fig. 1
- Fig. 1
- Fig. 1
- Fig. 1
- Fig. 1
- Fig. 1
- Fig. 1
- Fig. 1
- Fig. 1
- Fig. 1
- Fig. 1
- Fig. 1
- Fig. 1
- Fig. 1
- Fig. 1
- Fig. 2
- Fig. 2
- Fig. 2
- Fig. 2
- Fig. 2
- Fig. 2
- Fig. 2
- Fig. 2
- Fig. 2
- Fig. 2
- Fig. 2
- Fig. 2
- Fig. 2
- Fig. 2
- Fig. 2
- Fig. 2
- Fig. 2
- Fig. 2
- Fig. 2
- Fig. 2
- Fig. 2
- Fig. 2
- Fig. 2
- Fig. 2
- Fig. 2
- Fig. 2
- Fig. 2
- Fig. 2
- Fig. 2
- Fig. 2
- Fig. 2
- Fig. 2
- Fig. 2
- Fig. 2
- Fig. 2
- Fig. 2
- Fig. 2
- Fig. 2
- Fig. 2
- Fig. 2
- Fig. 2
- Fig. 2
- Fig. 2
- Fig. 2
- Fig. 2
- Fig. 2
- Fig. 2
- Fig. 2
- Fig. 2
- Fig. 2
- Fig. 2
- Fig. 2
- Fig. 2
- Fig. 2
- Fig. 2
- Fig. 2
- Fig. 2
- Fig. 2
- Fig. 2
- Fig. 2
- Fig. 2
- Fig. 2
- Fig. 2
- Fig. 2
- Fig. 2
- Fig. 2
- Fig. 2
- Fig. 2
- Fig. 2
- Fig. 2
- Fig. 2
- Fig. 2
- Fig. 2
- Fig. 2
- Fig. 2
- Fig. 2
- Fig. 2
- Fig. 2
- Fig. 2
- Fig. 2
- Fig. 2
- Fig. 2
- Fig. 2
- Fig. 2
- Fig. 2
- Fig. 2
- Fig. 2
- Fig. 2
- Fig. 2
- Fig. 2
- Fig. 2
- Fig. 2
- Fig. 2
- Fig. 2
- Fig. 2
- Fig. 2
- Fig. 2
- Fig. 2
- Fig. 2
- Fig. 2
- Fig. 2
- Fig. 2
- Fig. 2
- Fig. 2
- Fig. 2
- Fig. 2
- Fig. 2
- Fig. 2
- Fig. 2
- Fig. 2
- Fig. 2
- Fig. 2
- Fig. 2
- Fig. 2
- Fig. 2
- Fig. 2
- Fig. 2
- Fig. 2
- Fig. 2
- Fig. 2
- Fig. 2
- Fig. 2
- Fig. 2
- Fig. 2
- Fig. 2
- Fig. 2
- Fig. 2
- Fig. 2
- Fig. 2
- Fig. 2
- Fig. 2
- Fig. 2
- Fig. 2
- Fig. 2
- Fig. 2
- Fig. 2
- Fig. 2
- Fig. 2
- Fig. 2
- Fig. 2
- Fig. 2
- Fig. 2
- Fig. 2
- Fig. 2
- Fig. 2
- Fig. 2
- Fig. 2
- Fig. 2
- Fig. 2
- Fig. 2
- Fig. 2
- Fig. 2
- Fig. 2
- Fig. 2
- Fig. 2
- Fig. 2
- Fig. 2
- Fig. 2
- Fig. 2
- Fig. 2
- Fig. 2
- Fig. 2
- Fig. 2
- Fig. 2
- Fig. 2
- Fig. 2
- Fig. 2
- Fig. 2
- Fig. 2
- Fig. 2
- Fig. 2
- Fig. 2
- Fig. 2
- Fig. 2
- Fig. 2
- Fig. 2
- Fig. 2
- Fig. 2
- Fig. 2
- Fig. 2
- Fig. 2
- Fig. 2
- Fig. 2
- Fig. 2
- Fig. 2
- Fig. 2
- Fig. 2
- Fig. 2
- Fig. 2
- Fig. 2
- Fig. 2
- Fig. 2
- Fig. 2
- Fig. 2
- Fig. 2
- Fig. 2
- Fig. 2
- Fig. 2
- Fig. 2
- Fig. 2
- Fig. 2
- Fig. 2
- Fig. 2
- Fig. 2
- Fig. 2
- Fig. 2
- Fig. 2
- Fig. 2
- Fig. 2
- Fig. 2
- Fig. 2
- Fig. 2
- Fig. 2
- Fig. 2
- Fig. 2
- Fig. 2
- Fig. 2
- Fig. 2
- Fig. 2
- Fig. 2
- Fig. 2
- Fig. 2
- Fig. 2
- Fig. 2
- Fig. 2
- Fig. 2
- Fig. 2
- Fig. 2
- Fig. 2
- Fig. 2
- Fig. 2
- Fig. 2
- Fig. 2
- Fig. 2
- Fig. 2
- Fig. 2
- Fig. 2
- Fig. 2
- Fig. 2
- Fig. 2
- Fig. 2
- Fig. 2
- Fig. 2
- Fig. 2
- Fig. 2
- Fig. 2
- Fig. 2
- Fig. 2
- Fig. 2
- Fig. 2
- Fig. 2
- Fig. 2
- Fig. 2
- Fig. 2
- Fig. 2
- Fig. 2
- Fig. 2
- Fig. 2
- Fig. 2
- Fig. 2
- Fig. 2
- Fig. 2
- Fig. 2
- Fig. 2
- Fig. 2
- Fig. 2
- Fig. 2
- Fig. 2
- Fig. 2
- Fig. 2
- Fig. 2
- Fig. 2
- Fig. 2
- Fig. 2
- Fig. 2
- Fig. 2
- Fig. 2
- Fig. 2
- Fig. 2
- Fig. 2
- Fig. 2
- Fig. 2
- Fig. 2
- Fig. 2
- Fig. 2
- Fig. 2
- Fig. 2
- Fig. 2
- Fig. 2
- Fig. 2
- Fig. 2
- Fig. 2
- Fig. 2
- Fig. 2
- Fig. 2
- Fig. 2
- Fig. 2
- Fig. 2
- Fig. 2
- Fig. 2
- Fig. 2
- Fig. 2
- Fig. 2
- Fig. 2
- Fig. 2
- Fig. 2
- Fig. 2
- Fig. 2
- Fig. 2
- Fig. 2
- Fig. 2
- Fig. 2
- Fig. 2
- Fig. 2
- Fig. 2
- Fig. 2
- Fig. 2
- Fig. 2
- Fig. 2
- Fig. 2
- Fig. 2
- Fig. 2
- Fig. 2
- Fig. 2
- Fig. 2
- Fig. 2
- Fig. 2
- Fig. 2
- Fig. 2
- Fig. 2
- Fig. 2
- Fig. 2
- Fig. 2
- Fig. 2
- Fig. 2
- Fig. 2
- Fig. 2
- Fig. 2
- Fig. 2
- Fig. 2
- Fig. 2
- Fig. 2
- Fig. 2
- Fig. 2
- Fig. 2
- Fig. 2
- Fig. 2
- Fig. 2
- Fig. 2
- Fig. 2
- Fig. 2
- Fig. 2
- Fig. 2
- Fig. 2
- Fig. 2
- Fig. 2
- Fig. 2
- Fig. 2
- Fig. 2
- Fig. 2
- Fig. 2
- Fig. 2
- Fig. 2
- Fig. 2
- Fig. 2
- Fig. 2
- Fig. 2
- Fig. 2
- Fig. 2
- Fig. 2
- Fig. 2
- Fig. 2
- Fig. 2
- Fig. 2
- Fig. 2
- Fig. 2
- Fig. 2
- Fig. 2
- Fig. 2
- Fig. 2
- Fig. 2
- Fig. 2
- Fig. 2
- Fig. 2
- Fig. 2
- Fig. 2
- Fig. 2
- Fig. 2
- Fig. 2
- Fig. 2
- Fig. 2
- Fig. 2
- Fig. 2
- Fig. 2
- Fig. 2
- Fig. 2
- Fig. 2
- Fig. 2
- Fig. 2
- Fig. 2
- Fig. 2
- Fig. 2
- Fig. 2
- Fig. 2
- Fig. 2
- Fig. 2
- Fig. 2
- Fig. 2
- Fig. 2
- Fig. 2
- Fig. 2
- Fig. 2
- Fig. 2
- Fig. 2
- Fig. 2
- Fig. 2
- Fig. 2
- Fig. 2
- Fig. 2
- Fig. 2
- Fig. 2
- Fig. 2
- Fig. 2
- Fig. 2
- Fig. 2
- Fig. 2
- Fig. 2
- Fig. 2
- Fig. 2
- Fig. 2
- Fig. 2
- Fig. 2
- Fig. 2
- Fig. 2
- Fig. 2
- Fig. 2
- Fig. 2
- Fig. 2
- Fig. 3
- Fig. 3
- Fig. 3
- Fig. 3
- Fig. 3
- Fig. 3
- Fig. 3
- Fig. 3
- Fig. 3
- Fig. 3
- Fig. 3
- Fig. 3
- Fig. 3
- Fig. 3
- Fig. 3
- Fig. 3
- Fig. 3
- Fig. 3
- Fig. 3
- Fig. 3
- Fig. 3
- Fig. 3
- Fig. 3
- Fig. 3
- Fig. 3
- Fig. 3
- Fig. 3
- Fig. 3
- Fig. 3
- Fig. 3
- Fig. 3
- Fig. 3
- Fig. 3
- Fig. 3
- Fig. 3
- Fig. 3
- Fig. 3
- Fig. 3
- Fig. 3
- Fig. 3
- Fig. 3
- Fig. 3
- Fig. 3
- Fig. 3
- Fig. 3
- Fig. 3
- Fig. 3
- Fig. 3
- Fig. 3
- Fig. 3
- Fig. 3
- Fig. 3
- Fig. 3
- Fig. 3
- Fig. 3
- Fig. 3
- Fig. 3
- Fig. 3
- Fig. 3
- Fig. 3
- Fig. 3
- Fig. 3
- Fig. 3
- Fig. 3
- Fig. 3
- Fig. 3
- Fig. 3
- Fig. 3
- Fig. 3
- Fig. 3
- Fig. 3
- Fig. 3
- Fig. 3
- Fig. 3
- Fig. 3
- Fig. 3
- Fig. 3
- Fig. 3
- Fig. 3
- Fig. 3
- Fig. 3
- Fig. 3
- Fig. 3
- Fig. 3
- Fig. 3
- Fig. 3
- Fig. 3
- Fig. 3
- Fig. 3
- Fig. 3
- Fig. 3
- Fig. 3
- Fig. 3
- Fig. 3
- Fig. 3
- Fig. 3
- Fig. 3
- Fig. 3
- Fig. 3
- Fig. 3
- Fig. 3
- Fig. 3
- Fig. 3
- Fig. 3
- Fig. 3
- Fig. 3
- Fig. 3
- Fig. 3
- Fig. 3
- Fig. 3
- Fig. 3
- Fig. 3
- Fig. 3
- Fig. 3
- Fig. 3
- Fig. 3
- Fig. 3
- Fig. 3
- Fig. 3
- Fig. 3
- Fig. 3
- Fig. 3
- Fig. 3
- Fig. 3
- Fig. 3
- Fig. 3
- Fig. 3
- Fig. 3
- Fig. 3
- Fig. 3
- Fig. 3
- Fig. 3
- Fig. 3
- Fig. 3
- Fig. 3
- Fig. 3
- Fig. 3
- Fig. 3
- Fig. 3
- Fig. 3
- Fig. 3
- Fig. 3
- Fig. 3
- Fig. 3
- Fig. 3
- Fig. 3
- Fig. 3
- Fig. 3
- Fig. 3
- Fig. 3
- Fig. 3
- Fig. 3
- Fig. 3
- Fig. 3
- Fig. 3
- Fig. 3
- Fig. 3
- Fig. 3
- Fig. 3
- Fig. 3
- Fig. 3
- Fig. 3
- Fig. 3
- Fig. 3
- Fig. 3
- Fig. 3
- Fig. 3
- Fig. 3
- Fig. 3
- Fig. 3
- Fig. 3
- Fig. 3
- Fig. 3
- Fig. 3
- Fig. 3
- Fig. 3
- Fig. 3
- Fig. 3
- Fig. 3
- Fig. 3
- Fig. 3
- Fig. 3
- Fig. 3
- Fig. 3
- Fig. 3
- Fig. 3
- Fig. 3
- Fig. 3
- Fig. 3
- Fig. 3
- Fig. 3
- Fig. 3
- Fig. 3
- Fig. 3
- Fig. 3
- Fig. 3
- Fig. 3
- Fig. 3
- Fig. 3
- Fig. 3
- Fig. 3
- Fig. 3
- Fig. 3
- Fig. 3
- Fig. 3
- Fig. 3
- Fig. 3
- Fig. 3
- Fig. 3
- Fig. 3
- Fig. 3
- Fig. 3
- Fig. 3
- Fig. 3
- Fig. 3
- Fig. 3
- Fig. 3
- Fig. 3
- Fig. 3
- Fig. 3
- Fig. 3
- Fig. 3
- Fig. 3
- Fig. 3
- Fig. 3
- Fig. 3
- Fig. 3
- Fig. 3
- Fig. 3
- Fig. 3
- Fig. 3
- Fig. 3
- Fig. 3
- Fig. 3
- Fig. 3
- Fig. 3
- Fig. 3
- Fig. 3
- Fig. 3
- Fig. 3
- Fig. 3
- Fig. 3
- Fig. 3
- Fig. 3
- Fig. 3
- Fig. 3
- Fig. 3
- Fig. 3
- Fig. 3
- Fig. 3
- Fig. 3
- Fig. 3
- Fig. 3
- Fig. 3
- Fig. 3
- Fig. 3
- Fig. 3
- Fig. 3
- Fig. 3
- Fig. 3
- Fig. 3
- Fig. 3
- Fig. 3
- Fig. 3
- Fig. 3
- Fig. 3
- Fig. 3
- Fig. 3
- Fig. 3
- Fig. 3
- Fig. 3
- Fig. 3
- Fig. 3
- Fig. 3
- Fig. 3
- Fig. 3
- Fig. 3
- Fig. 3
- Fig. 3
- Fig. 3
- Fig. 3
- Fig. 3
- Fig. 3
- Fig. 3
- Fig. 3
- Fig. 3
- Fig. 3
- Fig. 3
- Fig. 3
- Fig. 3
- Fig. 3
- Fig. 3
- Fig. 3
- Fig. 3
- Fig. 3
- Fig. 3
- Fig. 3
- Fig. 3
- Fig. 3
- Fig. 3
- Fig. 3
- Fig. 3
- Fig. 3
- Fig. 3
- Fig. 3
- Fig. 3
- Fig. 3
- Fig. 3
- Fig. 3
- Fig. 3
- Fig. 3
- Fig. 3
- Fig. 3
- Fig. 3
- Fig. 3
- Fig. 3
- Fig. 3
- Fig. 3
- Fig. 3
- Fig. 3
- Fig. 3
- Fig. 3
- Fig. 3
- Fig. 3
- Fig. 3
- Fig. 3
- Fig. 3
- Fig. 3
- Fig. 3
- Fig. 3
- Fig. 3
- Fig. 3
- Fig. 3
- Fig. 3
- Fig. 3
- Fig. 3
- Fig. 3
- Fig. 3
- Fig. 3
- Fig. 3
- Fig. 3
- Fig. 3
- Fig. 3
- Fig. 3
- Fig. 3
- Fig. 3
- Fig. 3
- Fig. 3
- Fig. 3
- Fig. 3
- Fig. 3
- Fig. 3
- Fig. 3
- Fig. 3
- Fig. 3
- Fig. 3
- Fig. 3
- Fig. 3
- Fig. 3
- Fig. 3
- Fig. 3
- Fig. 3
- Fig. 3
- Fig. 3
- Fig. 3
- Fig. 3
- Fig. 3
- Fig. 3
- Fig. 3
- Fig. 3
- Fig. 3
- Fig. 3
- Fig. 3
- Fig. 3
- Fig. 3
- Fig. 3
- Fig. 3
- Fig. 3
- Fig. 3
- Fig. 3
- Fig. 3
- Fig. 3
- Fig. 3
- Fig. 3
- Fig. 3
- Fig. 3
- Fig. 3
- Fig. 3
- Fig. 3
- Fig. 3
- Fig. 3
- Fig. 3
- Fig. 3
- Fig. 3
- Fig. 3
- Fig. 3
- Fig. 3
- Fig. 3
- Fig. 3
- Fig. 3
- Fig. 3
- Fig. 3
- Fig. 3
- Fig. 3
- Fig. 3
- Fig. 3
- Fig. 3
- Fig. 3
- Fig. 3
- Fig. 3
- Fig. 3
- Fig. 3
- Fig. 3
- Fig. 3
- Fig. 3
- Fig. 3
- Fig. 3
- Fig. 3
- Fig. 3
- Fig. 3
- Fig. 3
- Fig. 3
- Fig. 3
- Fig. 3
- Fig. 3
- Fig. 3
- Fig. 3
- Fig. 3
- Fig. 3
- Fig. 3
- Fig. 3
- Fig. 3
- Fig. 3
- Fig. 3
- Fig. 3
- Fig. 3
- Fig. 3
- Fig. 3
- Fig. 4
- Fig. 4
- Fig. 4
- Fig. 4
- Fig. 4
- Fig. 4
- Fig. 4
- Fig. 4
- Fig. 4
- Fig. 4
- Fig. 4
- Fig. 4
- Fig. 4
- Fig. 4
- Fig. 4
- Fig. 4
- Fig. 4
- Fig. 4
- Fig. 4
- Fig. 4
- Fig. 4
- Fig. 4
- Fig. 4
- Fig. 4
- Fig. 4
- Fig. 4
- Fig. 4
- Fig. 4
- Fig. 4
- Fig. 4
- Fig. 4
- Fig. 4
- Fig. 4
- Fig. 4
- Fig. 4
- Fig. 4
- Fig. 4
- Fig. 4
- Fig. 4
- Fig. 4
- Fig. 4
- Fig. 4
- Fig. 4
- Fig. 4
- Fig. 4
- Fig. 4
- Fig. 4
- Fig. 4
- Fig. 4
- Fig. 4
- Fig. 4
- Fig. 4
- Fig. 4
- Fig. 4
- Fig. 4
- Fig. 4
- Fig. 4
- Fig. 4
- Fig. 4
- Fig. 4
- Fig. 4
- Fig. 4
- Fig. 4
- Fig. 4
- Fig. 4
- Fig. 4
- Fig. 4
- Fig. 4
- Fig. 4
- Fig. 4
- Fig. 4
- Fig. 4
- Fig. 4
- Fig. 4
- Fig. 4
- Fig. 4
- Fig. 4
- Fig. 4
- Fig. 4
- Fig. 4
- Fig. 4
- Fig. 4
- Fig. 4
- Fig. 4
- Fig. 4
- Fig. 4
- Fig. 4
- Fig. 4
- Fig. 4
- Fig. 4
- Fig. 4
- Fig. 4
- Fig. 4
- Fig. 4
- Fig. 4
- Fig. 4
- Fig. 4
- Fig. 4
- Fig. 4
- Fig. 4
- Fig. 4
- Fig. 4
- Fig. 4
- Fig. 4
- Fig. 4
- Fig. 4
- Fig. 4
- Fig. 4
- Fig. 4
- Fig. 4
- Fig. 4
- Fig. 4
- Fig. 4
- Fig. 4
- Fig. 4
- Fig. 4
- Fig. 4
- Fig. 4
- Fig. 4
- Fig. 4
- Fig. 4
- Fig. 4
- Fig. 4
- Fig. 4
- Fig. 4
- Fig. 4
- Fig. 4
- Fig. 4
- Fig. 4
- Fig. 4
- Fig. 4
- Fig. 4
- Fig. 4
- Fig. 4
- Fig. 4
- Fig. 4
- Fig. 4
- Fig. 4
- Fig. 4
- Fig. 4
- Fig. 4
- Fig. 4
- Fig. 4
- Fig. 4
- Fig. 4
- Fig. 4
- Fig. 4
- Fig. 4
- Fig. 4
- Fig. 4
- Fig. 4
- Fig. 4
- Fig. 4
- Fig. 4
- Fig. 4
- Fig. 4
- Fig. 4
- Fig. 4
- Fig. 4
- Fig. 4
- Fig. 4
- Fig. 4
- Fig. 4
- Fig. 4
- Fig. 4
- Fig. 4
- Fig. 4
- Fig. 4
- Fig. 4
- Fig. 4
- Fig. 4
- Fig. 4
- Fig. 4
- Fig. 4
- Fig. 4
- Fig. 4
- Fig. 4
- Fig. 4
- Fig. 4
- Fig. 4
- Fig. 4
- Fig. 4
- Fig. 4
- Fig. 4
- Fig. 4
- Fig. 4
- Fig. 4
- Fig. 4
- Fig. 4
- Fig. 4
- Fig. 4
- Fig. 4
- Fig. 4
- Fig. 4
- Fig. 4
- Fig. 4
- Fig. 4
- Fig. 4
- Fig. 4
- Fig. 4
- Fig. 4
- Fig. 4
- Fig. 4
- Fig. 4
- Fig. 4
- Fig. 4
- Fig. 4
- Fig. 4
- Fig. 4
- Fig. 4
- Fig. 4
- Fig. 4
- Fig. 4
- Fig. 4
- Fig. 4
- Fig. 4
- Fig. 4
- Fig. 4
- Fig. 4
- Fig. 4
- Fig. 4
- Fig. 4
- Fig. 4
- Fig. 4
- Fig. 4
- Fig. 4
- Fig. 4
- Fig. 4
- Fig. 4
- Fig. 4
- Fig. 4
- Fig. 4
- Fig. 4
- Fig. 4
- Fig. 4
- Fig. 4
- Fig. 4
- Fig. 4
- Fig. 4
- Fig. 4
- Fig. 4
- Fig. 4
- Fig. 4
- Fig. 4
- Fig. 4
- Fig. 4
- Fig. 4
- Fig. 4
- Fig. 4
- Fig. 4
- Fig. 4
- Fig. 4
- Fig. 4
- Fig. 4
- Fig. 4
- Fig. 4
- Fig. 4
- Fig. 4
- Fig. 4
- Fig. 4
- Fig. 4
- Fig. 4
- Fig. 4
- Fig. 4
- Fig. 4
- Fig. 4
- Fig. 4
- Fig. 4
- Fig. 4
- Fig. 4
- Fig. 4
- Fig. 4
- Fig. 4
- Fig. 4
- Fig. 4
- Fig. 4
- Fig. 4
- Fig. 4
- Fig. 4
- Fig. 4
- Fig. 4
- Fig. 4
- Fig. 4
- Fig. 4
- Fig. 4
- Fig. 4
- Fig. 4
- Fig. 4
- Fig. 4
- Fig. 4
- Fig. 4
- Fig. 4
- Fig. 4
- Fig. 4
- Fig. 4
- Fig. 4
- Fig. 4
- Fig. 4
- Fig. 4
- Fig. 4
- Fig. 4
- Fig. 4
- Fig. 4
- Fig. 4
- Fig. 4
- Fig. 4
- Fig. 4
- Fig. 4
- Fig. 4
- Fig. 4
- Fig. 4
- Fig. 4
- Fig. 4
- Fig. 4
- Fig. 4
- Fig. 4
- Fig. 4
- Fig. 4
- Fig. 4
- Fig. 4
- Fig. 4
- Fig. 4
- Fig. 4
- Fig. 4
- Fig. 4
- Fig. 4
- Fig. 4
- Fig. 4
- Fig. 4
- Fig. 4
- Fig. 4
- Fig. 4
- Fig. 4
- Fig. 4
- Fig. 4
- Fig. 4
- Fig. 4
- Fig. 4
- Fig. 4
- Fig. 4
- Fig. 4
- Fig. 4
- Fig. 4
- Fig. 4
- Fig. 4
- Fig. 4
- Fig. 4
- Fig. 4
- Fig. 4
- Fig. 4
- Fig. 4
- Fig. 4
- Fig. 4
- Fig. 4
- Fig. 4
- Fig. 4
- Fig. 4
- Fig. 4
- Fig. 4
- Fig. 4
- Fig. 4
- Fig. 4
- Fig. 4
- Fig. 4
- Fig. 4
- Fig. 4
- Fig. 4
- Fig. 4
- Fig. 4
- Fig. 4
- Fig. 4
- Fig. 4
- Fig. 4
- Fig. 4
- Fig. 4
- Fig. 4
- Fig. 4
- Fig. 4
- Fig. 4
- Fig. 4
- Fig. 4
- Fig. 4
- Fig. 4
- Fig. 4
- Fig. 4
- Fig. 4
- Fig. 4
- Fig. 4
- Fig. 4
- Fig. 4
- Fig. 4
- Fig. 4
- Fig. 4
- Fig. 4
- Fig. 4
- Fig. 4
- Fig. 4
- Fig. 4
- Fig. 4
- Fig. 4
- Fig. 4
- Fig. 4
- Fig. 4
- Fig. 4
- Fig. 4
- Fig. 4
- Fig. 4
- Fig. 4
- Fig. 4
- Fig. 4
- Fig. 4
- Fig. 4
- Fig. 4
- Fig. 4
- Fig. 4
- Fig. 4
- Fig. 4
- Fig. 4
- Fig. 4
- Fig. 4
- Fig. 4
- Fig. 4
- Fig. 4
- Fig. 4
- Fig. 4
- Fig. 4
- Fig. 4
- Fig. 4
- Fig. 4
- Fig. 4
- Fig. 4
- Fig. 4
- Fig. 4
- Fig. 4
- Fig. 4
- Fig. 4
- Fig. 4
- Fig. 4
- Fig. 5
- Fig. 5
- Fig. 5
- Fig. 5
- Fig. 5
- Fig. 5
- Fig. 5
- Fig. 5
- Fig. 5
- Fig. 5
- Fig. 5
- Fig. 5
- Fig. 5
- Fig. 5
- Fig. 5
- Fig. 5
- Fig. 5
- Fig. 5
- Fig. 5
- Fig. 5
- Fig. 5
- Fig. 5
- Fig. 5
- Fig. 5
- Fig. 5
- Fig. 5
- Fig. 5
- Fig. 5
- Fig. 5
- Fig. 5
- Fig. 5
- Fig. 5
- Fig. 5
- Fig. 5
- Fig. 5
- Fig. 5
- Fig. 5
- Fig. 5
- Fig. 5
- Fig. 5
- Fig. 5
- Fig. 5
- Fig. 5
- Fig. 5
- Fig. 5
- Fig. 5
- Fig. 5
- Fig. 5
- Fig. 5
- Fig. 5
- Fig. 5
- Fig. 5
- Fig. 5
- Fig. 5
- Fig. 5
- Fig. 5
- Fig. 5
- Fig. 5
- Fig. 5
- Fig. 5
- Fig. 5
- Fig. 5
- Fig. 5
- Fig. 5
- Fig. 5
- Fig. 5
- Fig. 5
- Fig. 5
- Fig. 5
- Fig. 5
- Fig. 5
- Fig. 5
- Fig. 5
- Fig. 5
- Fig. 5
- Fig. 5
- Fig. 5
- Fig. 5
- Fig. 5
- Fig. 5
- Fig. 5
- Fig. 5
- Fig. 5
- Fig. 5
- Fig. 5
- Fig. 5
- Fig. 5
- Fig. 5
- Fig. 5
- Fig. 5
- Fig. 5
- Fig. 5
- Fig. 5
- Fig. 5
- Fig. 5
- Fig. 5
- Fig. 5
- Fig. 5
- Fig. 5
- Fig. 5
- Fig. 5
- Fig. 5
- Fig. 5
- Fig. 5
- Fig. 5
- Fig. 5
- Fig. 5
- Fig. 5
- Fig. 5
- Fig. 5
- Fig. 5
- Fig. 5
- Fig. 5
- Fig. 5
- Fig. 5
- Fig. 5
- Fig. 5
- Fig. 5
- Fig. 5
- Fig. 5
- Fig. 5
- Fig. 5
- Fig. 5
- Fig. 5
- Fig. 5
- Fig. 5
- Fig. 5
- Fig. 5
- Fig. 5
- Fig. 5
- Fig. 5
- Fig. 5
- Fig. 5
- Fig. 5
- Fig. 5
- Fig. 5
- Fig. 5
- Fig. 5
- Fig. 5
- Fig. 5
- Fig. 5
- Fig. 5
- Fig. 5
- Fig. 5
- Fig. 5
- Fig. 5
- Fig. 5
- Fig. 5
- Fig. 5
- Fig. 5
- Fig. 5
- Fig. 5
- Fig. 5
- Fig. 5
- Fig. 5
- Fig. 5
- Fig. 5
- Fig. 5
- Fig. 5
- Fig. 5
- Fig. 5
- Fig. 5
- Fig. 5
- Fig. 5
- Fig. 5
- Fig. 5
- Fig. 5
- Fig. 5
- Fig. 5
- Fig. 5
- Fig. 5
- Fig. 5
- Fig. 5
- Fig. 5
- Fig. 5
- Fig. 5
- Fig. 5
- Fig. 5
- Fig. 5
- Fig. 5
- Fig. 5
- Fig. 5
- Fig. 5
- Fig. 5
- Fig. 5
- Fig. 5
- Fig. 5
- Fig. 5
- Fig. 5
- Fig. 5
- Fig. 5
- Fig. 5
- Fig. 5
- Fig. 5
- Fig. 5
- Fig. 5
- Fig. 5
- Fig. 5
- Fig. 5
- Fig. 5
- Fig. 5
- Fig. 5
- Fig. 5
- Fig. 5
- Fig. 5
- Fig. 5
- Fig. 5
- Fig. 5
- Fig. 5
- Fig. 5
- Fig. 5
- Fig. 5
- Fig. 5
- Fig. 5
- Fig. 5
- Fig. 5
- Fig. 5
- Fig. 5
- Fig. 5
- Fig. 5
- Fig. 5
- Fig. 5
- Fig. 5
- Fig. 5
- Fig. 5
- Fig. 5
- Fig. 5
- Fig. 5
- Fig. 5
- Fig. 5
- Fig. 5
- Fig. 5
- Fig. 5
- Fig. 5
- Fig. 5
- Fig. 5
- Fig. 5
- Fig. 5
- Fig. 5
- Fig. 5
- Fig. 5
- Fig. 5
- Fig. 5
- Fig. 5
- Fig. 5
- Fig. 5
- Fig. 5
- Fig. 5
- Fig. 5
- Fig. 5
- Fig. 5
- Fig. 5
- Fig. 5
- Fig. 5
- Fig. 5
- Fig. 5
- Fig. 5
- Fig. 5
- Fig. 5
- Fig. 5
- Fig. 5
- Fig. 5
- Fig. 5
- Fig. 5
- Fig. 5
- Fig. 5
- Fig. 5
- Fig. 5
- Fig. 5
- Fig. 5
- Fig. 5
- Fig. 5
- Fig. 5
- Fig. 5
- Fig. 5
- Fig. 5
- Fig. 5
- Fig. 5
- Fig. 5
- Fig. 5
- Fig. 5
- Fig. 5
- Fig. 5
- Fig. 5
- Fig. 5
- Fig. 5
- Fig. 5
- Fig. 5
- Fig. 5
- Fig. 5
- Fig. 5
- Fig. 5
- Fig. 5
- Fig. 5
- Fig. 5
- Fig. 5
- Fig. 5
- Fig. 5
- Fig. 5
- Fig. 5
- Fig. 5
- Fig. 5
- Fig. 5
- Fig. 5
- Fig. 5
- Fig. 5
- Fig. 5
- Fig. 5
- Fig. 5
- Fig. 5
- Fig. 5
- Fig. 5
- Fig. 5
- Fig. 5
- Fig. 5
- Fig. 5
- Fig. 5
- Fig. 5
- Fig. 5
- Fig. 5
- Fig. 5
- Fig. 5
- Fig. 5
- Fig. 5
- Fig. 5
- Fig. 5
- Fig. 5
- Fig. 5
- Fig. 5
- Fig. 5
- Fig. 5
- Fig. 5
- Fig. 5
- Fig. 5
- Fig. 5
- Fig. 5
- Fig. 5
- Fig. 5
- Fig. 5
- Fig. 5
- Fig. 5
- Fig. 5
- Fig. 5
- Fig. 5
- Fig. 5
- Fig. 5
- Fig. 5
- Fig. 5
- Fig. 5
- Fig. 5
- Fig. 5
- Fig. 5
- Fig. 5
- Fig. 5
- Fig. 5
- Fig. 5
- Fig. 5
- Fig. 5
- Fig. 5
- Fig. 5
- Fig. 5
- Fig. 5
- Fig. 5
- Fig. 5
- Fig. 5
- Fig. 5
- Fig. 5
- Fig. 5
- Fig. 5
- Fig. 5
- Fig. 5
- Fig. 5
- Fig. 5
- Fig. 5
- Fig. 5
- Fig. 5
- Fig. 5
- Fig. 5
- Fig. 5
- Fig. 5
- Fig. 5
- Fig. 5
- Fig. 5
- Fig. 5
- Fig. 5
- Fig. 5
- Fig. 5
- Fig. 5
- Fig. 5
- Fig. 5
- Fig. 5
- Fig. 5
- Fig. 5
- Fig. 5
- Fig. 5
- Fig. 5
- Fig. 5
- Fig. 5
- Fig. 5
- Fig. 5
- Fig. 5
- Fig. 5
- Fig. 5
- Fig. 5
- Fig. 5
- Fig. 5
- Fig. 5
- Fig. 5
- Fig. 5
- Fig. 5
- Fig. 5
- Fig. 5
- Fig. 5
- Fig. 5
- Fig. 5
- Fig. 5
- Fig. 5
- Fig. 5
- Fig. 5
- Fig. 5
- Fig. 5
- Fig. 5
- Fig. 5
- Fig. 5
- Fig. 5
- Fig. 5
- Fig. 5
- Fig. 5
- Fig. 5
- Fig. 5
- Fig. 5
- Fig. 5
- Fig. 5
- Fig. 5
- Fig. 5
- Fig. 5
- Fig. 5
- Fig. 5
- Fig. 6
- Fig. 6
- Fig. 6
- Fig. 6
- Fig. 6
- Fig. 6
- Fig. 6
- Fig. 6
- Fig. 6
- Fig. 6
- Fig. 6
- Fig. 6
- Fig. 6
- Fig. 6
- Fig. 6
- Fig. 6
- Fig. 6
- Fig. 6
- Fig. 6
- Fig. 6
- Fig. 6
- Fig. 6
- Fig. 6
- Fig. 6
- Fig. 6
- Fig. 6
- Fig. 6
- Fig. 6
- Fig. 6
- Fig. 6
- Fig. 6
- Fig. 6
- Fig. 6
- Fig. 6
- Fig. 6
- Fig. 6
- Fig. 6
- Fig. 6
- Fig. 6
- Fig. 6
- Fig. 6
- Fig. 6
- Fig. 6
- Fig. 6
- Fig. 6
- Fig. 6
- Fig. 6
- Fig. 6
- Fig. 6
- Fig. 6
- Fig. 6
- Fig. 6
- Fig. 6
- Fig. 6
- Fig. 6
- Fig. 6
- Fig. 6
- Fig. 6
- Fig. 6
- Fig. 6
- Fig. 6
- Fig. 6
- Fig. 6
- Fig. 6
- Fig. 6
- Fig. 6
- Fig. 6
- Fig. 6
- Fig. 6
- Fig. 6
- Fig. 6
- Fig. 6
- Fig. 6
- Fig. 6
- Fig. 6
- Fig. 6
- Fig. 6
- Fig. 6
- Fig. 6
- Fig. 6
- Fig. 6
- Fig. 6
- Fig. 6
- Fig. 6
- Fig. 6
- Fig. 6
- Fig. 6
- Fig. 6
- Fig. 6
- Fig. 6
- Fig. 6
- Fig. 6
- Fig. 6
- Fig. 6
- Fig. 6
- Fig. 6
- Fig. 6
- Fig. 6
- Fig. 6
- Fig. 6
- Fig. 6
- Fig. 6
- Fig. 6
- Fig. 6
- Fig. 6
- Fig. 6
- Fig. 6
- Fig. 6
- Fig. 6
- Fig. 6
- Fig. 6
- Fig. 6
- Fig. 6
- Fig. 6
- Fig. 6
- Fig. 6
- Fig. 6
- Fig. 6
- Fig. 6
- Fig. 6
- Fig. 6
- Fig. 6
- Fig. 6
- Fig. 6
- Fig. 6
- Fig. 6
- Fig. 6
- Fig. 6
- Fig. 6
- Fig. 6
- Fig. 6
- Fig. 6
- Fig. 6
- Fig. 6
- Fig. 6
- Fig. 6
- Fig. 6
- Fig. 6
- Fig. 6
- Fig. 6
- Fig. 6
- Fig. 6
- Fig. 6
- Fig. 6
- Fig. 6
- Fig. 6
- Fig. 6
- Fig. 6
- Fig. 6
- Fig. 6
- Fig. 6
- Fig. 6
- Fig. 6
- Fig. 6
- Fig. 6
- Fig. 6
- Fig. 6
- Fig. 6
- Fig. 6
- Fig. 6
- Fig. 6
- Fig. 6
- Fig. 6
- Fig. 6
- Fig. 6
- Fig. 6
- Fig. 6
- Fig. 6
- Fig. 6
- Fig. 6
- Fig. 6
- Fig. 6
- Fig. 6
- Fig. 6
- Fig. 6
- Fig. 6
- Fig. 6
- Fig. 6
- Fig. 6
- Fig. 6
- Fig. 6
- Fig. 6
- Fig. 6
- Fig. 6
- Fig. 6
- Fig. 6
- Fig. 6
- Fig. 6
- Fig. 6
- Fig. 6
- Fig. 6
- Fig. 6
- Fig. 6
- Fig. 6
- Fig. 6
- Fig. 6
- Fig. 6
- Fig. 6
- Fig. 6
- Fig. 6
- Fig. 6
- Fig. 6
- Fig. 6
- Fig. 6
- Fig. 6
- Fig. 6
- Fig. 6
- Fig. 6
- Fig. 6
- Fig. 6
- Fig. 6
- Fig. 6
- Fig. 6
- Fig. 6
- Fig. 6
- Fig. 6
- Fig. 6
- Fig. 6
- Fig. 6
- Fig. 6
- Fig. 6
- Fig. 6
- Fig. 6
- Fig. 6
- Fig. 6
- Fig. 6
- Fig. 6
- Fig. 6
- Fig. 6
- Fig. 6
- Fig. 6
- Fig. 6
- Fig. 6
- Fig. 6
- Fig. 6
- Fig. 6
- Fig. 6
- Fig. 6
- Fig. 6
- Fig. 6
- Fig. 6
- Fig. 6
- Fig. 6
- Fig. 6
- Fig. 6
- Fig. 6
- Fig. 6
- Fig. 6
- Fig. 6
- Fig. 6
- Fig. 6
- Fig. 6
- Fig. 6
- Fig. 6
- Fig. 6
- Fig. 6
- Fig. 6
- Fig. 6
- Fig. 6
- Fig. 6
- Fig. 6
- Fig. 6
- Fig. 6
- Fig. 6
- Fig. 6
- Fig. 6
- Fig. 6
- Fig. 6
- Fig. 6
- Fig. 6
- Fig. 6
- Fig. 6
- Fig. 6
- Fig. 6
- Fig. 6
- Fig. 6
- Fig. 6
- Fig. 6
- Fig. 6
- Fig. 6
- Fig. 6
- Fig. 6
- Fig. 6
- Fig. 6
- Fig. 6
- Fig. 6
- Fig. 6
- Fig. 6
- Fig. 6
- Fig. 6
- Fig. 6
- Fig. 6
- Fig. 6
- Fig. 6
- Fig. 6
- Fig. 6
- Fig. 6
- Fig. 6
- Fig. 6
- Fig. 6
- Fig. 6
- Fig. 6
- Fig. 6
- Fig. 6
- Fig. 6
- Fig. 6
- Fig. 6
- Fig. 6
- Fig. 6
- Fig. 6
- Fig. 6
- Fig. 6
- Fig. 6
- Fig. 6
- Fig. 6
- Fig. 6
- Fig. 6
- Fig. 6
- Fig. 6
- Fig. 6
- Fig. 6
- Fig. 6
- Fig. 6
- Fig. 6
- Fig. 6
- Fig. 6
- Fig. 6
- Fig. 6
- Fig. 6
- Fig. 6
- Fig. 6
- Fig. 6
- Fig. 6
- Fig. 6
- Fig. 6
- Fig. 6
- Fig. 6
- Fig. 6
- Fig. 6
- Fig. 6
- Fig. 6
- Fig. 6
- Fig. 6
- Fig. 6
- Fig. 6
- Fig. 6
- Fig. 6
- Fig. 6
- Fig. 6
- Fig. 6
- Fig. 6
- Fig. 6
- Fig. 6
- Fig. 6
- Fig. 6
- Fig. 6
- Fig. 6
- Fig. 6
- Fig. 6
- Fig. 6
- Fig. 6
- Fig. 6
- Fig. 6
- Fig. 6
- Fig. 6
- Fig. 6
- Fig. 6
- Fig. 6
- Fig. 6
- Fig. 6
- Fig. 6
- Fig. 6
- Fig. 6
- Fig. 6
- Fig. 6
- Fig. 6
- Fig. 6
- Fig. 6
- Fig. 6
- Fig. 6
- Fig. 6
- Fig. 6
- Fig. 6
- Fig. 6
- Fig. 6
- Fig. 6
- Fig. 6
- Fig. 6
- Fig. 6
- Fig. 6
- Fig. 6
- Fig. 6
- Fig. 6
- Fig. 6
- Fig. 6
- Fig. 6
- Fig. 6
- Fig. 6
- Fig. 6
- Fig. 6
- Fig. 6
- Fig. 6
- Fig. 6
- Fig. 6
- Fig. 6
- Fig. 6
- Fig. 6
- Fig. 6
- Fig. 6
- Fig. 6
- Fig. 6
- Fig. 6
- Fig. 6
- Fig. 6
- Fig. 6
- Fig. 6
- Fig. 6
- Fig. 6
- Fig. 6
- Fig. 6
- Fig. 6
- Fig. 6
- Fig. 6
- Fig. 6
- Fig. 6
- Fig. 6
- Fig. 6
- Fig. 6
- Fig. 6
- Fig. 6
- Fig. 6
- Fig. 6
- Fig. 6
- Fig. 7
- Fig. 7
- Fig. 7
- Fig. 7
- Fig. 7
- Fig. 7
- Fig. 7
- Fig. 7
- Fig. 7
- Fig. 7
- Fig. 7
- Fig. 7
- Fig. 7
- Fig. 7
- Fig. 7
- Fig. 7
- Fig. 7
- Fig. 7
- Fig. 7
- Fig. 7
- Fig. 7
- Fig. 7
- Fig. 7
- Fig. 7
- Fig. 7
- Fig. 7
- Fig. 7
- Fig. 7
- Fig. 7
- Fig. 7
- Fig. 7
- Fig. 7
- Fig. 7
- Fig. 7
- Fig. 7
- Fig. 7
- Fig. 7
- Fig. 7
- Fig. 7
- Fig. 7
- Fig. 7
- Fig. 7
- Fig. 7
- Fig. 7
- Fig. 7
- Fig. 7
- Fig. 7
- Fig. 7
- Fig. 7
- Fig. 7
- Fig. 7
- Fig. 7
- Fig. 7
- Fig. 7
- Fig. 7
- Fig. 7
- Fig. 7
- Fig. 7
- Fig. 7
- Fig. 7
- Fig. 7
- Fig. 7
- Fig. 7
- Fig. 7
- Fig. 7
- Fig. 7
- Fig. 7
- Fig. 7
- Fig. 7
- Fig. 7
- Fig. 7
- Fig. 7
- Fig. 7
- Fig. 7
- Fig. 7
- Fig. 7
- Fig. 7
- Fig. 7
- Fig. 7
- Fig. 7
- Fig. 7
- Fig. 7
- Fig. 7
- Fig. 7
- Fig. 7
- Fig. 7
- Fig. 7
- Fig. 7
- Fig. 7
- Fig. 7
- Fig. 7
- Fig. 7
- Fig. 7
- Fig. 7
- Fig. 7
- Fig. 7
- Fig. 7
- Fig. 7
- Fig. 7
- Fig. 7
- Fig. 7
- Fig. 7
- Fig. 7
- Fig. 7
- Fig. 7
- Fig. 7
- Fig. 7
- Fig. 7
- Fig. 7
- Fig. 7
- Fig. 7
- Fig. 7
- Fig. 7
- Fig. 7
- Fig. 7
- All Figure Page
- Back to All Figure Page
Fig. 4
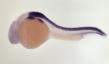

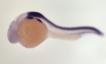


Fig. 4 CNS from posterior hindbrain to posterior spinal chord, pectoral fin bud, posterior branchial arches |
Expression Data
| Gene: | |
|---|---|
| Fish: | |
| Anatomical Terms: | |
| Stage Range: | 20-25 somites to Prim-5 |
| Probe: | eu419 Quality: |
Expression Detail
Antibody Labeling
Phenotype Data
Phenotype Detail
Acknowledgments
This image is the copyrighted work of the attributed author or publisher, and
ZFIN has permission only to display this image to its users.
Additional permissions should be obtained from the applicable author or publisher of the image.