
- Title
-
Acute Stress Effects over Time on Gene Expression Patterns in the Male Zebrafish (Danio rerio) Brain
- Authors
- Pietsch, C., Konrad, J., Pawlak, P.
- Source
- Full text @ Animals (Basel)

Overview of the expression profiles of early immediate genes (IEGs) in the telencephalon (tel), hypothalamus (hyp), optic tectum (opt), and rhombencephalon (rhomb) of male zebrafish 0, 30, 60, and 90 min after the treatment, whereby feed-rewarding, feed-control treatment, chasing, confinement, and air exposure were used as stressors. N = 6 per treatment. The significance value |
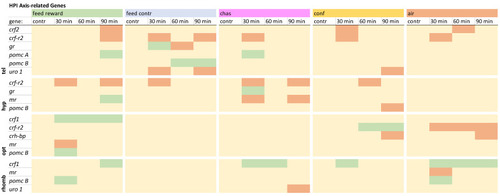
Overview of the gene expression profiles of HPI axis-related genes in the telencephalon (tel), hypothalamus (hyp), optic tectum (opt), and rhombencephalon (rhomb) of male zebrafish 0, 30, 60, and 90 min after the treatment, whereby feed-rewarding, feed-control treatment, chasing, confinement, and air exposure were used as stressors. N = 6 per treatment. The significance value |
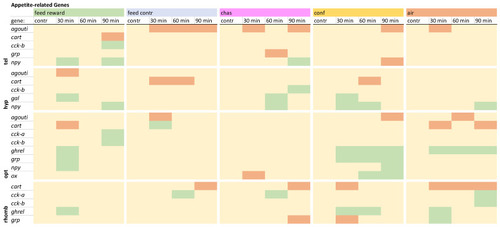
Overview of the gene expression profiles of appetite-related genes in the telencephalon (tel), hypothalamus (hyp), optic tectum (opt), and rhombencephalon (rhomb) of male zebrafish 0, 30, 60, and 90 min after the treatment, whereby feed-rewarding, feed-control treatment, chasing, confinement, and air exposure were used as stressors. N = 6 per treatment. The significance value |
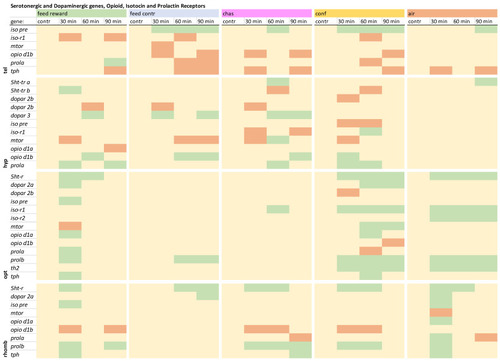
Overview of the gene expression profiles of the serotonergic and dopaminergic genes, opioid, isotocin and the prolactin receptors in the telencephalon (tel), hypothalamus (hyp), optic tectum (opt), and rhombencephalon (rhomb) of male zebrafish 0, 30, 60, and 90 min after the treatment, whereby feed-rewarding, feed-control treatment, chasing, confinement, and air exposure were used as stressors. N = 6 per treatment. The significance value |