
- Title
-
A human homolog of SIR2 antiphage proteins mediates immunity via the Toll-like receptor pathway
- Authors
- Bonhomme, D., Vaysset, H., Ednacot, E.M.Q., Rodrigues, V., Salloum, Y., Cury, J., Wang, A., Benchetrit, A., Affaticati, P., Trejo, V.H., Vittot, P., Bories, C., Cornec, A., Levraud, J.P., Hernández, P.P., Benaroch, P., Morehouse, B.R., Bernheim, A., Poirier, E.Z.
- Source
- Full text @ Science
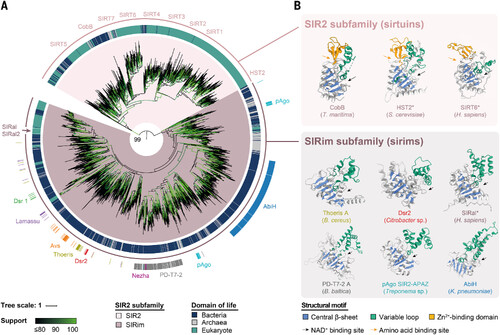
Human proteins belonging to the monophyletic group of SIRim proteins are associated with bacterial antiphage defense proteins. (A) Phylogenetic tree of SIR2 family proteins across the tree of life. A total of 2723 sequences representative of all the SIR2 domain–containing proteins identified through a homology search were used to build the tree (midpoint rooted). SIR2 proteins cluster into two subfamilies based on amino acid sequences, namely SIR2 (inner ring, beige) and SIRim (inner ring, brown). The domain of life from which each protein originates is provided in the central ring (blue, bacteria; gray, archaea; green, eukaryotes). For proteins identified in bacterial organisms, we assessed whether the protein is present in a known antiphage defense system and indicated its name (outer ring) (21). The location of human sirtuins (SIRT1 to SIRT7), of SIRal and SIRal2, and of other proteins shown in (B) are indicated. Tree branch support values were assessed using UltraFast Bootstrap and are indicated in shades of green. Support is also specified on the branch delimiting the two subfamilies. (B) Structures of selected SIR2 proteins from the SIR2 subfamily (top, beige) and the SIRim subfamily (bottom, brown). Three sirtuins [CobB (PDB ID 2H2F), HST2 (PDB ID 1SZC), and SIRT6 (AFDB ID Q8N6T7)] and six sirims [Thoeris A (AFDB ID J8G6Z1, residues 1 to 279), Dsr2 (AFDB ID R8X3J8, residues 1 to 281), SIRal (AFDB ID Q9BPY3), PD-T7-2 A (AFDB ID I3Z638), pAgo SIR2-APAZ (EMBL ID AIW90156), and AbiH (AFDB ID A0A1V0M776)] are provided (PDB, Protein Data Bank; AFDB, AlphaFold Protein Structure Database; EMBL, European Molecular Biology Laboratory). For bacterial sirims, the name of the protein is colored according to the antiphage system in which the protein is found. In ThsA, Dsr2, and pAgo, only the SIRim domain is shown while it is fused to additional domains in the original proteins. The central β sheet of the Rossmann fold (blue) and the variable loop (green) are highlighted to underline the structural similarities between proteins. For each protein, the species of origin is indicated. An asterisk after a protein name indicates that it is found in a eukaryotic organism. Organisms featured are Thermotoga maritima, Saccharomyces cerevisiae, Homo sapiens, Bacillus cereus, Citrobacter sp. KTE151, Belliella baltica, Treponema sp. OMZ 838 and Klebsiella pneumoniae. |
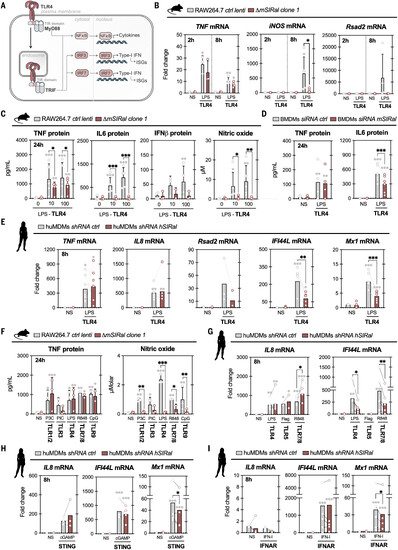
SIRal contributes to TLR signaling in macrophages. (A) Schematic of TLR4 signaling in macrophages. (B) Wild-type or ΔmSIRal RAW264.7 cells were stimulated with LPS from E. coli (100 ng/ml). Levels of TNF, iNOS, and Rsad2 transcripts were measured by RT-qPCR (reverse transcription–quantitative polymerase chain reaction) at 2 and 8 hours. NS, not stimulated. (C) Wild-type or ΔmSIRal RAW264.7 cells were stimulated with LPS from E. coli (10 to 100 ng/ml). Production of TNF, IL-6, IFN-β, and NO was measured at 24 hours. (D) Mouse bone marrow–derived macrophages (BMDMs) transfected with a control small interfering RNA (siRNA) or a siRNA targeting mSIRal were stimulated with LPS from E. coli (100 ng/ml). Production of TNF and IL-6 was measured at 24 hours. (E) Human monocyte-derived macrophages (huMDMs) transduced with a control short hairpin RNA (shRNA) or a shRNA targeting hSIRal were stimulated with LPS from E. coli (100 ng/ml). Levels of TNF, IL-8, Rsad2, IFI44L, and Mx1 transcripts were measured by RT-qPCR at 8 hours. (F) Wild-type or ΔmSIRal RAW264.7 cells were stimulated with Pam3CysSK4 (500 ng/ml), Poly(I:C) (1 μg/ml), LPS (100 ng/ml), R848 (1 μg/ml), or CpG (1 μg/ml), which are agonists of TLR1/2, TLR3, TLR4, TLR7/8, and TLR9, respectively. Production of TNF and NO was measured at 24 hours. (G) huMDMs transduced with a control shRNA or a shRNA targeting hSIRal were stimulated with LPS (100 ng/ml), flagellin (500 ng/ml), or R848 (1 μg/ml), which are agonists of TLR4, TLR5, and TLR7/8, respectively. Levels of IL-8 and IFI44L transcripts were measured by RT-qPCR at 8 hours. (H and I) huMDMs transduced with a control shRNA or a shRNA targeting hSIRal were stimulated with either cGAMP (the agonist of STING, 4 μg/ml) (H) or universal type I IFN (activator of IFNAR, 100 U/ml) (I). Levels of IL-8, IFI44L, and Mx1 transcripts were measured by RT-qPCR at 8 hours. Each dot represents the mean of technical replicates for each independent experiment [(B), (C), and (F)], independent mouse BMDM isolation (D), or independent human donor [(E), (G), (H), and (I)]. Bars correspond to the mean and error bars to the standard deviation of all the independent experiments, mice, or donors. Statistical analyses were performed using two-way analysis of variance (ANOVA); *p < 0.05, **p < 0.01, and ***p < 0.001, where gray asterisks correspond to comparisons within one group and black asterisks correspond to comparisons between groups. |
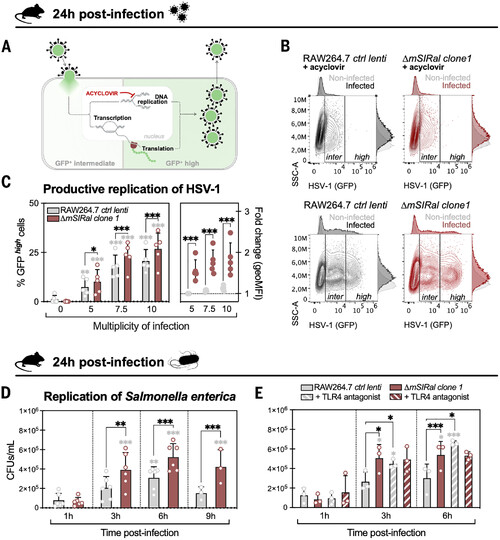
mSIRal contributes to the control of HSV-1 and Salmonella in macrophages. (A) Schematic of HSV-1-GFP infection. Viral particles contain GFP fused to the capsid protein VP26, and hence, viral entry is detected in cells by intermediate GFP levels, as measured by flow cytometry. Productive viral replication results in GFP production and high levels of fluorescence. Viral replication, but not entry, is inhibited by the drug acyclovir. (B) Wild-type or ΔmSIRal RAW264.7 cells were either infected or not infected with HSV-1 [multiplicity of infection (MOI) 7.5] in the presence or absence of acyclovir. Levels of GFP were measured by flow cytometry at 24 hours. (C) Wild-type or ΔmSIRal RAW264.7 cells were either infected or not infected with HSV-1 (MOI 5 to 10). Levels of GFP were measured by flow cytometry at 24 hours, and the percentage of productively infected cells (GFPhigh) was determined. The geometric mean fluorescence intensity (geoMFI) of the GFPhigh population is indicated as a surrogate of viral replication. (D and E) Wild-type or ΔmSIRal RAW264.7 cells were infected with S. enterica serovar Typhimurium strain SL1344 (MOI 10). Intracellular replication of bacteria was quantified by CFU after gentamicin protection assay. In (E), LPS from R. sphaeroides (1 μg/ml) was used as a TLR4 antagonist. Each dot represents the mean of technical replicates for each independent experiment [(C), (D), and (E)]. Bars correspond to the mean and error bars to the standard deviation of all the independent experiments. Statistical analyses were performed using two-way ANOVA; *p < 0.05, **p < 0.01, and ***p < 0.001, where gray asterisks correspond to comparisons within one group and black asterisks correspond to comparisons between groups. |
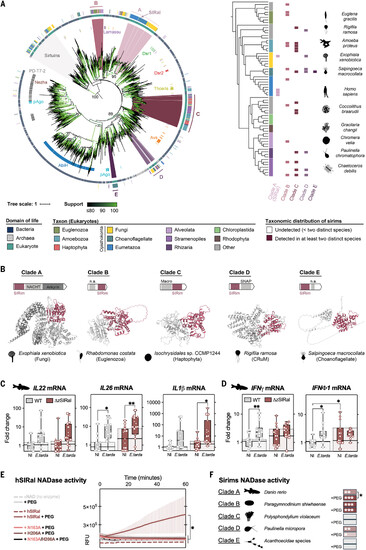
SIRal is part of a large family of sirims in eukaryotes, including NADases with immune functions. (A) Shown on the left is a phylogenetic tree of all identified SIRim domain–containing proteins across the tree of life. Representative sequences of all detected bacterial, archaeal, and eukaryotic sirims (n = 2266) are aligned on their SIRim domain, and a phylogenetic tree was built from the multiple sequence alignment. The domain of life of each protein is indicated in the central ring (blue, bacteria; gray, archaea; green, eukaryotes), and the specific taxon is indicated for eukaryotic sequences in the outer ring. Antiphage systems were annotated using DefenseFinder for bacterial sirims (inner ring) (21). The five major eukaryotic clades of sirims (clades A to E) are colored in shades of purple (inner ring), and within each clade, specific sequences are detailed in (B). Branch support was assessed using UltraFast Bootstrap and is indicated in shades of green. Support values are indicated on key branches. Shown on the right is the taxonomic distribution of SIRim proteins in eukaryotes. The phylogenetic tree of The Comparative Set (TCS) from Eukprot includes 196 species from all major known eukaryotic phyla (39). The taxonomic distribution of each of the five eukaryotic SIRim protein clades is displayed. SIRim proteins detected in species present in the Eukprot v3 database (993 species) but not in TCS (196 species) were assigned to their closest relative present in the TCS tree. Sirim presence in a specific clade is reported only when at least two distinct species of the clade are identified as containing a sirim gene in their genome. The tree is midpoint rooted. The tree is also pruned, and branch lengths are ignored for visualization purposes (see fig. S5). For each major eukaryotic taxon, a logo of one example species encoding a sirim gene is provided. (B) Examples of sirims found in eukaryotic organisms. Sirims from each of the five major eukaryotic sirim clades are shown [(A) and figs. S5 to S7]. For each sequence, the domain architecture and the AlphaFold2 model are provided. The SIRim domain is colored in pink, and additional, fused, domains are indicated in gray. If the specified domain could be characterized using HHpred, its name is provided. NACHT (PF05729); SNAP (PF14938); n.a., domain not identified. (C and D) Wild-type or ΔzSIRal zebrafish larvae were infected with E. tarda. Levels of IL-22, IL-26, IL-1β, IFN-γ, and IFN-ϕ1 transcripts were measured by RT-qPCR at 3 days postinfection. Each symbol represents a larva, and bars correspond to the median of all the larvae. The three independent experiments are represented with dots, squares, and triangles. Statistical analyses were performed using two-way ANOVA; *p < 0.05, **p < 0.01, and ***p < 0.001. NI, not infected. (E) Enzymatic NADase activity assay of purified recombinant hSIRal (wild type, N163A mutant, H206A mutant, N163A/H206A double mutant) incubated with ε-NAD with or without PEG 400 over time. RFU, relative fluorescence units. (F) Purified recombinant zSIRal from D. rerio (Opisthokonta, clade A), sirim from P. shiwhaense (Alveolata, clade B), Polysphondylium violaceum (Amoebozoa, clade C), P. micropora (Rhizaria, clade D), or Acanthoecidae sp. (Opisthokonta, clade E) were incubated with NAD+ and with or without PEG 400. NADase activity was addressed by measuring NAD+ degradation by HPLC analysis after 16 hours of incubation with NAD+. Shades of red indicate statistical significance [p value notation is the same as in (D)]. |