
- Title
-
Rhabdomyosarcoma fusion oncoprotein initially pioneers a neural signature in vivo
- Authors
- Kucinski, J., Tallan, A., Taslim, C., Vontell, A.M., Silvius, K.M., Wang, M., Cannon, M.V., Stanton, B.Z., Kendall, G.C.
- Source
- Full text @ Cell Rep.
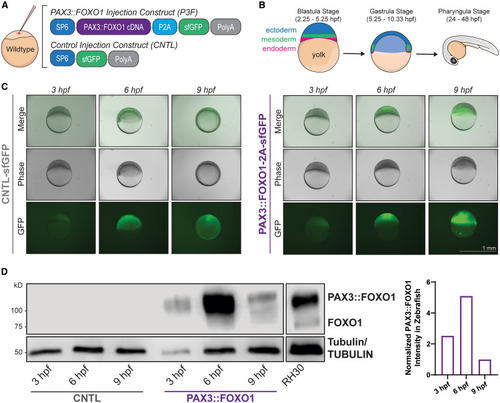
Zebrafish mRNA injection model highly expresses human PAX3::FOXO1 during embryonic development (A) Wildtype (WT) zebrafish embryos were injected at the one-cell stage with 100 ng/μL of PAX3::FOXO1 (P3F) or equal molarity of control (CNTL) mRNA. (B) Schematic of embryonic zebrafish development with positioning of primary germ layers at key time points used in experiments. (C) Representative merged, phase contrast, and GFP images of zebrafish embryos at 3, 6, and 9 developmental hours post-fertilization (hpf). Scale bar, 1 mm. (D) Representative western blot with protein lysate from 12 embryos per lane for each condition and 8 μg protein lysate from RH30 cells, a PAX3::FOXO1-positive patient-derived cell line. The PAX3::FOXO1 time course was repeated for a total of four replicates. Normalized quantification for the representative western blot of PAX3::FOXO1/TUBULIN signal in PAX3::FOXO1 zebrafish embryos is on the right; n = 1. |
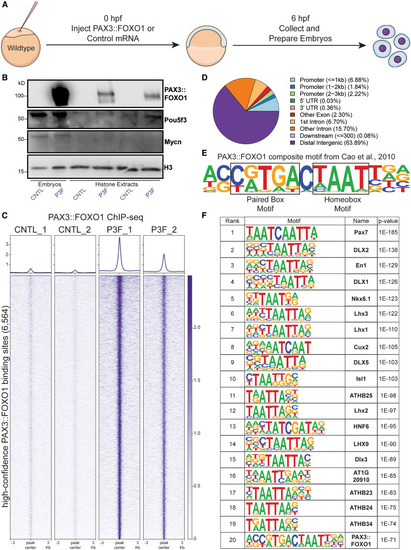
In vivo PAX3::FOXO1 ChIP-seq shows initial binding to homeobox-related motifs (A) Experimental schematic of mRNA injection with samples collected at the 6 developmental hpf time point. (B) Western blot on whole embryos (far left two) and histone extractions for protein-DNA interaction by blotting for PAX3::FOXO1, Pou5f3 (pioneer factor), Mycn (non-pioneer transcription factor), and histone H3 in CNTL and PAX3::FOXO1-injected (P3F) embryos. This experiment was repeated for nine replicates across 3 injection days. (C) PAX3::FOXO1 ChIP-seq signal across CNTL and P3F replicates at 6,564 high-confidence PAX3::FOXO1 binding sites. PAX3::FOXO1 binding sites were identified by MACS2 and had significant enrichment in P3F versus CNTL samples (edgeR, p = 0.05); see STAR Methods for additional peak determination information. PAX3::FOXO1 ChIP-seq was completed in duplicate from different injection days. (D) Annotation of PAX3::FOXO1 binding sites based on genomic localization. (E) Schematic of the composite PAX3::FOXO1 motif, which was originally identified by Cao et al.11 (F) Top 20 most-enriched known motifs at PAX3::FOXO1 binding sites by HOMER. |
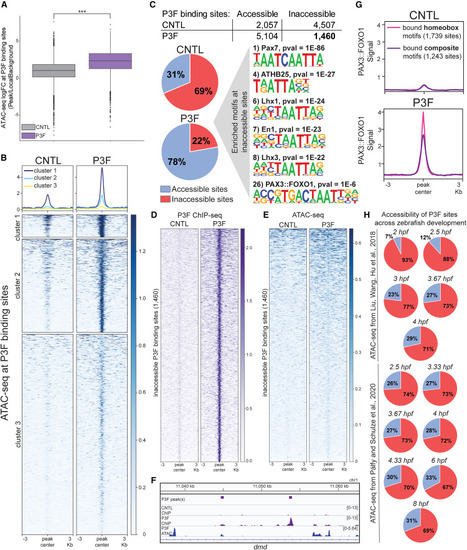
PAX3::FOXO1 invades inaccessible chromatin (A) Average quantified ATAC-seq signal between replicates at PAX3::FOXO1 binding sites in CNTL and PAX3::FOXO1-injected (P3F) embryos. Line represents the mean. ATAC-seq was completed in duplicate from different injection days. A paired t test between conditions was used to determine statistical significance. (B) Visualization of ATAC-seq signal at PAX3::FOXO1 binding sites across conditions. Average ATAC-seq signal between replicates was plotted and stratified by k-means clustering (k = 3). (C) Overlap between PAX3::FOXO1 binding sites and ATAC-seq peaks in CNTL and P3F embryos. Accessible sites are defined by binding overlap with an ATAC-seq peak, with inaccessible sites lacking an ATAC-seq peak. Known HOMER motif analysis was completed at inaccessible PAX3::FOXO1 binding sites in P3F embryos. (D and E) Average PAX3::FOXO1 ChIP-seq and ATAC-seq signal between replicates at the 1,460 inaccessible PAX3::FOXO1 binding sites, respectively. (F) Representative Integrative Genomics Viewer (IGV) tracks of intronic PAX3::FOXO1 binding in dmd lacking accessibility (right peak). (G) Average PAX3::FOXO1 ChIP-seq signal between replicates at bound homeobox motif binding sites, represented by the Pax7 motif in (C), and bound composite motif binding sites, represented by the PAX3::FOXO1 motif in (C). Profile plot represents average signal across homeobox and composite motifs, respectively. (H) Overlap between PAX3::FOXO1 binding sites and ATAC-seq peaks throughout early zebrafish development by hpf from publicly available ATAC-seq data from Liu et al.43 and Pálfy et al.44 Blue indicates accessible sites, and red represents inaccessible P3F sites. ∗∗∗p < 0.001. |

Generation of a neomorphic chromatin landscape is driven by PAX3::FOXO1 binding to its composite motif (A) Principal-component analysis (PCA) at differentially accessible ATAC-seq peaks in PAX3::FOXO1-injected (P3F) embryos versus CNTL embryos compared to publicly available ATAC-seq from Pálfy et al.44 across early zebrafish development according to hpf. (B) ATAC-seq signal at sites with increased accessibility (left) and decreased accessibility (right) in P3F versus CNTL embryo. (C) Most enriched known HOMER motif at sites with increased (top) or decreased (bottom) accessibility as shown in (B). (D) Overlap of consensus H3K27ac ChIP-seq peaks between replicates in CNTL and P3F embryos. H3K27ac ChIP-seq was completed in duplicate with CNTL embryos from different injection days and P3F embryos from the same injection day. (E) Average H3K27ac ChIP-seq signal between replicates at sites with significantly higher (left) and lower (right) H3K27ac deposition. (F) Most enriched known HOMER motif at sites with higher (top) or lower (bottom) H3K27ac ChIP-seq signal as shown in (E). (G and H) Average ATAC-seq and H3K27ac ChIP-seq signal, respectively, at bound PAX3::FOXO1 homeobox or composite motif sites. (I) Annotation of H3K27ac ChIP-seq peaks according to genomic localization in CNTL embryos, P3F embryos, sites with lower H3K27ac in P3F embryos, and sites with higher H3K27ac in P3F embryos, respectively. A Fisher’s exact test with a Bonferroni correction for multiple comparisons on proportion of peaks in promoter regions was used to determine statistical significance. (J) The activity-by-contact model from Fulco et al.47 inferred which genes were regulated by differentially enriched H3K27ac ChIP-seq peaks. The top five enriched Gene Ontology (GO) biological processes with DAVID analysis for genes regulated by sites with higher H3K27ac in P3F embryos (top) and lower H3K27ac in P3F embryos (bottom). ∗∗∗p < 0.001. |
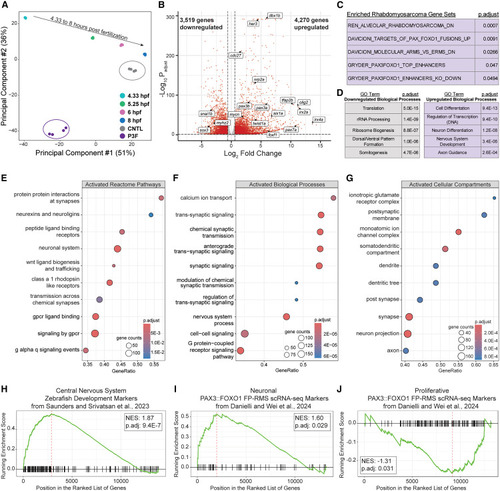
Neural and rhabdomyosarcoma gene signatures are transcriptionally activated in PAX3::FOXO1-injected embryos (A) PCA on normalized RNA-seq reads in CNTL versus PAX3::FOXO1-injected (P3F) embryos compared to publicly available RNA-seq during zebrafish blastulation and gastrulation according to hpf, from White et al.48 (B) Volcano plot of differentially expressed genes in P3F versus CNTL embryos. Significant genes (red) had an adjusted p < 0.05 and average fold change (FC) ≥ 1.5. Highlighted are manually selected genes related to rhabdomyosarcoma, tumorigenesis, myogenesis, and neural development. (C) Enriched rhabdomyosarcoma gene sets from the Molecular Signatures Database (MSigDB) from gene list pathway analysis with up and downregulated differentially expressed genes in P3F embryos. (D) The top five enriched GO biological processes with DAVID analysis for downregulated (left) and upregulated (right) genes in P3F embryos. (E) Gene set enrichment analysis (GSEA) for upregulated pathways in the Reactome pathway database on MSigDB. (F) GSEA for upregulated GO biological processes. (G) GSEA for upregulated GO cellular compartments. (H) GSEA to markers of the developing zebrafish central nervous system, identified from scRNA-seq analysis from Saunders et al.57 (I and J) GSEA to PAX3::FOXO1-driven rhabdomyosarcoma cell population markers identified from scRNA-seq analysis in Danielli et al.58 |
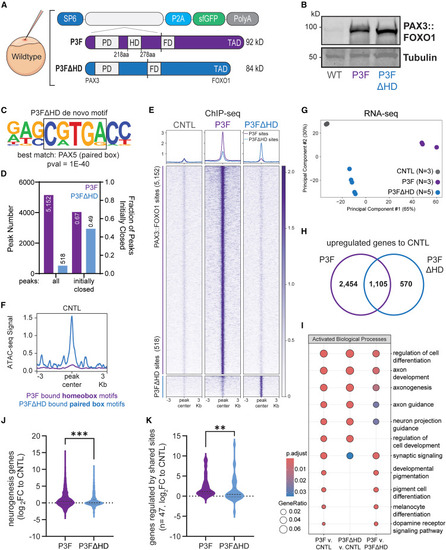
Removal of the homeobox DNA binding domain suppresses PAX3::FOXO1 genomic binding and transcriptional activation (A) Schematic of wild-type zebrafish embryo injections at the one-cell stage, with PAX3::FOXO1 homeobox domain deletion (P3FΔHD) mRNA at equal molarity to full-length PAX3::FOXO1 (P3F). (B) Representative western blot with protein lysate from 12 embryos per condition. The western was repeated for a total of five replicates. (C) Top de novo HOMER motif at P3FΔHD binding sites. (D) Plot of total peak number (left) and peak fraction that lacked overlap with an ATAC-seq peak in CNTL embryos (right). (E) Heatmap of P3F and P3FΔHD signal at their respective binding sites by ChIP-seq. (F) Profile plot of ATAC-seq signal in CNTL embryos at P3F-bound homeobox motifs, top motif in Figure 2F, in purple, and P3FΔHD paired box motifs, motif from Figure 6C, in blue. (G) PCA of normalized RNA-seq reads in CNTL, P3F, and P3FΔHD-injected embryos. (H) Venn diagram of overlapping upregulated genes from P3F, purple, or P3FΔHD, blue, compared to CNTL embryos. (I) Gene over-representation analysis of upregulated genes between conditions. (J and K) Violin plot of log2FC versus CNTL of neurogenesis GO term genes and genes regulated by shared P3F and P3FΔHD binding sites according to the activity-by-contact model, respectively. Line represents the mean. A Mann-Whitney test was used to determine statistical significance for log2FC plots. ∗∗p < 0.01; ∗∗∗p < 0.001. |
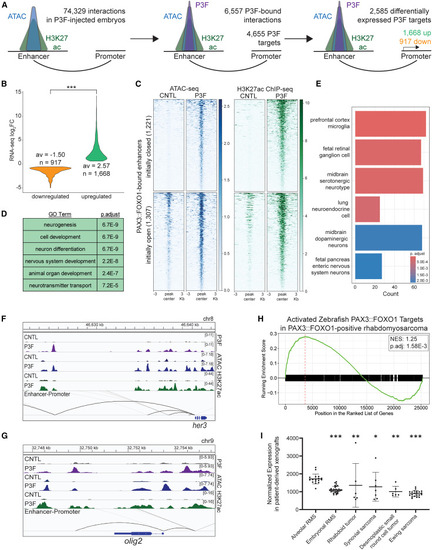
PAX3::FOXO1 directly and epigenetically activates neural-related gene targets (A) Diagram representing the focus on 2,585 genes that are differentially expressed according to RNA-seq and regulated by a PAX3::FOXO1-bound enhancer in PAX3::FOXO1-injected (P3F) embryos according to the activity-by-contact model. (B) Log2FC expression in P3F versus CNTL embryos of differentially expressed genes in Figure 7A. A Mann-Whitney test on absolute values was used to determine statistical significance. (C) Average ATAC and H3K27ac signal between replicates at the 2,528 PAX3::FOXO1-bound enhancers that regulate activated genes, respectively. (D) The top five enriched GO biological processes with DAVID analysis for genes directly upregulated by PAX3::FOXO1; n = 1,668. (E) Top six enriched cell type signatures from MSigDB from gene list pathway analysis, with genes directly upregulated by PAX3::FOXO1. (F and G) Representative IGV tracks of activation of neural zebrafish transcription factors her3 and olig2 in P3F embryos, respectively. Top tracks are PAX3::FOXO1 ChIP-seq (purple), middle tracks are ATAC-seq (blue), and lower tracks are H3K27ac ChIP-seq (green). Black lines indicate predicted enhancer-promoter interactions. (H) GSEA for activated genes from (A) on publicly available RNA-seq between PAX3::FOXO1-patient tumors and skeletal muscle RNA-seq from Shern et al.2 (I) Average normalized expression of genes enriched in patient tumors from (H) in each publicly available patient-derived xenografts from Stewart et al.63 Data are represented as mean expression and error bars represent standard deviation. ∗p < 0.05; ∗∗p < 0.01; ∗∗∗p < 0.001. |