
- Title
-
Effect of Calcination Temperature and Strontium Addition on the Properties of Sol-Gelled Bioactive Glass Powder
- Authors
- Chang, P.J., Chen, J.Y., Cheng, C.H., Aoki, K., Su, C.Y., Lin, C.K.
- Source
- Full text @ Gels

Thermogravimetric analysis of 0SBG and 5SBG powders. |

X-ray diffraction patterns of as-prepared and calcined ( |
X-ray diffraction patterns of 0–7SBG powder after calcination at 650 °C for 3 h. |
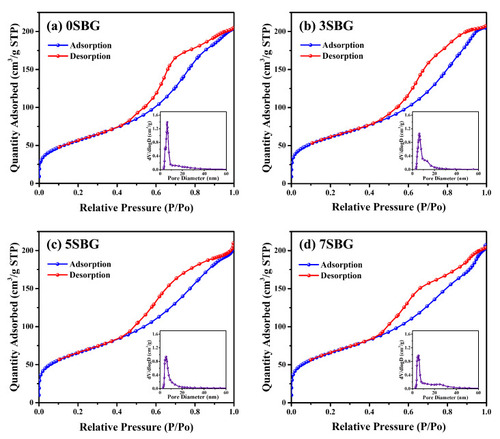
BET analysis of ( |

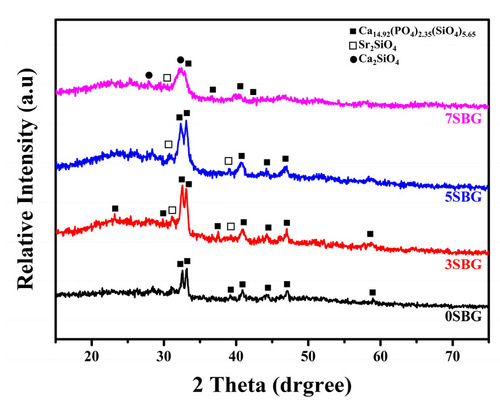
XRD patterns of ( |
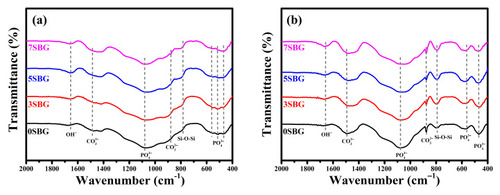
FT-IR spectra of 0-7 SBG powder ( |

The FTIR deconvolution curves ( |
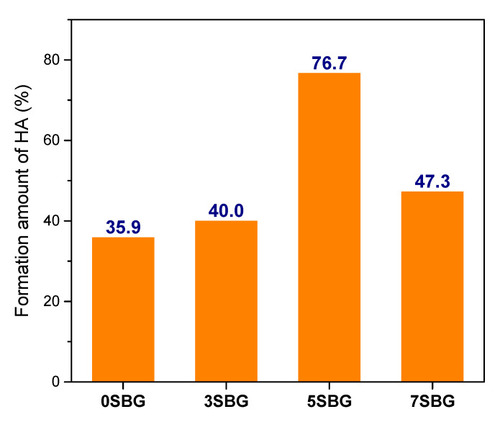
The formation amount of HA calculated from the fitting area of PO43− in FTIR spectra. |
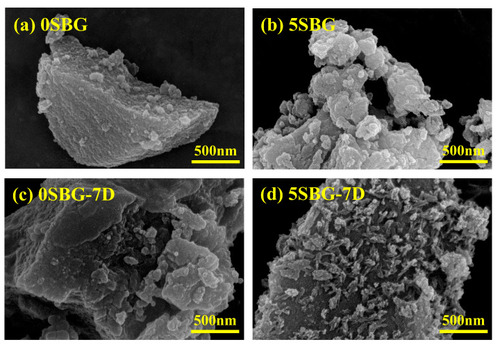
SEM images for 0SBG and 5SBG before ( |
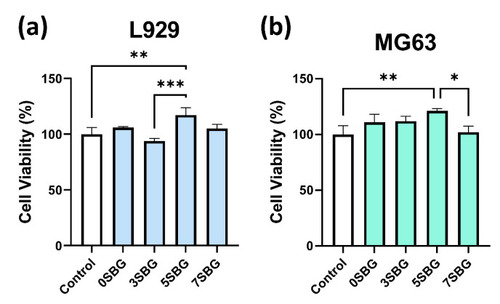
Cell viabilities of ( |
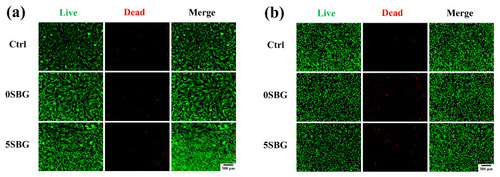
Live/dead staining assay of ( |
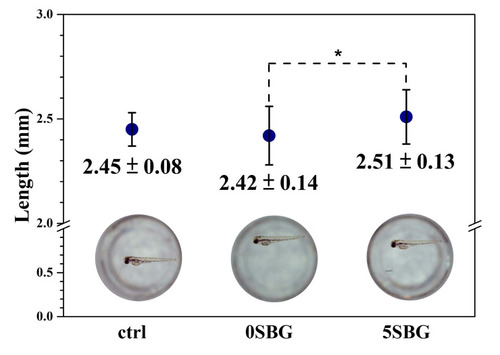
The average length and a typical image of zebrafish after 72 h post-fertilization. * indicated that these two samples were statistically different at a 95% confidence interval. |