
- Title
-
Anti-Melanogenesis Activity of Peptides from Shark (Mustelus griseus) Skin on B16F10 Melanocytes and In vivo Zebrafish Models
- Authors
- Hu, Y., Su, W., Wang, B., Yang, X., Ke, L., Shi, Y., Wang, Y., Wang, Q.
- Source
- Full text @ Appl. Biochem. Biotechnol.

Growth inhibitory effects (A) and morphologic changes (B) of shark skin peptides on B16F10. A B16F10 cells were treated with different concentrations of shark skin peptides for different time periods. The cell growth inhibition was determined by MTT assay. B Morphologic changes in the B16F10 cells after exposure to different concentrations (a, b, c, and d represent 0, 160, 320, and 1280 μg/mL, respectively) of shark skin peptides for 24 h |

The inhibitory effect of melanin synthesis in B16F10 by different concentrations of shark skin peptides. A The precipitation color changes of B16F10 cells after being treated with different concentrations of shark skin peptides for 72 h. B Melanin content with different concentrations of shark skin peptides by measuring the absorbance of the cells. C The inhibition effect of shark skin peptides on intracellular tyrosinase in B16F10 cells. D Tyrosinase activity staining of B16F10 cells treated with different concentrations of shark skin peptides. Vertical bars represent the standard deviation of means. *P < 0.05 and **P < 0.01 compared to the control group |
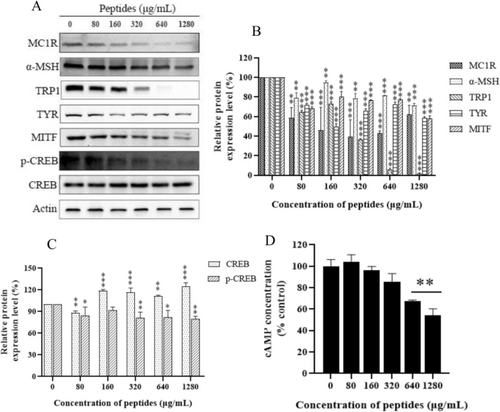
Effects of shark skin peptides on melanogenesis-related proteins and signaling pathways in B16F10 cells. A Expressions of melanogenesis-related proteins in B16F10 cells treated with shark skin peptides. B Relative protein expression levels of melanogenesis-related proteins in B16F10 cells treated with shark skin peptides. C Relative protein expression levels of p-CREB and CREB proteins. D Changes in intracellular cAMP after shark skin peptide treatment. *P < 0.05 and **P < 0.01 compared to the control group |

Effect of shark skin peptides on the activity of ROS in B16F10. A Flow cytometry peak diagram of B16F10 cells treated with different concentrations of shark skin peptides. In the figure, the grey, red, blue, and green peaks respectively represent the concentrations of 0, 160, 640, and 1280 μg/mL. B Relative fluorescence intensity of B16F10 cells treated with different concentrations (0, 160, 640, and 1280 μg/mL) of shark skin peptides. *P < 0.05 and **P < 0.01 compared to the control group |

Shark skin peptides inhibited the melanin production in zebrafish. A The survival rate of zebrafish treated with different concentration of shark skin peptides. B Effect of shark skin peptides on the pigmentation of zebrafish. C Effects of shark skin peptides on the melanin content extracting from zebrafish. D Effects of shark skin peptides on the expression of melanogenesis-related proteins in zebrafish. E Relative protein expression levels of melanogenesis-related proteins in zebrafish. *P < 0.05 and **P < 0.01 compared to the control group |