FIGURE SUMMARY
Title

Lycium ruthenicum Murray Anthocyanins Alleviate Aging Through SIRT1/P53 Signaling Pathway

Authors
Liang, J., Ga, Z., Wu, J., Wang, Y., Dongzhu, N., Qieyang, R., Li, P., Huaqian, S.
Source
Full text @ Int. J. Mol. Sci.

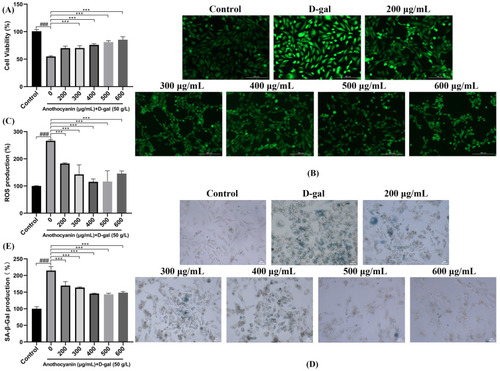
Effect of LRA on D-gal-induced senescence of H9c2 cells. (A) Cell viability was evaluated by CCK-8 assay; (B) ROS fluorescence staining (microscopic magnification: 200×); (C) Quantitative analysis of ROS fluorescent intensity; (D) SA-β-gal fluorescent staining (microscopic magnification: 200×); (E) Quantitative analysis of SA-β-gal fluorescence intensity; Statistical significance: ### p < 0.001 vs. Control group; *** p < 0.001 vs. D-gal group.

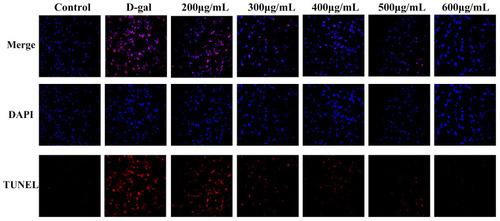
The effect of LRAs on D-galactose-induced apoptosis in H9c2 cells. TUNEL and DAPI co-staining (microscopic magnification: 100×). Red represents TUNEL, and blue represents DAPI.

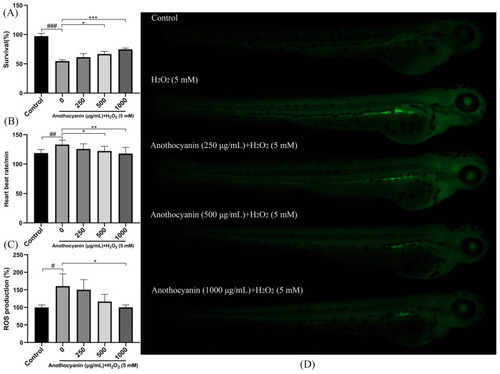
Effect of LRAs on H2O2-induced survival rate, heartbeat, and ROS production in zebrafish larvae. (
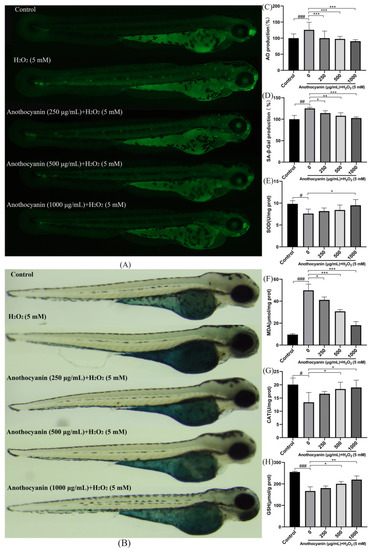
A) The impact of LRA on zebrafish survival rate; (B) the impact of LRAs on zebrafish heartbeat; (C,D) effect of LRAs on H2O2-induced ROS production in zebrafish larvae; statistical significance: # p < 0.05, ## p < 0.01, ### p < 0.001 vs. Control group; * p < 0.05, ** p < 0.01, *** p < 0.001 vs. H2O2 group.

(A,C) Effect of LRA on H2O2-induced AO fluorescence in zebrafish larval; (B,D) Effect of LRA on H2O2-induced SA-β-gal activity in zebrafish larval; (EH) Effects of LRA on oxidative stress markers: (E) SOD; (F) MDA; (G) CAT; (H) GSH; Statistical significance: # p < 0.05, ## p < 0.01, ### p < 0.001 vs. Control group; * p < 0.05, ** p < 0.01, *** p < 0.001 vs. H2O2 group.

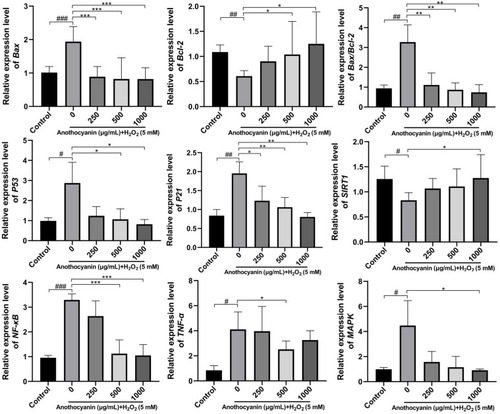
Effects of LRA on the expression of related genes in zebrafish. Statistical significance: # p < 0.05, ## p < 0.01, ### p < 0.001 vs. Control group; * p < 0.05, ** p < 0.01, *** p < 0.001 vs. H2O2 group.

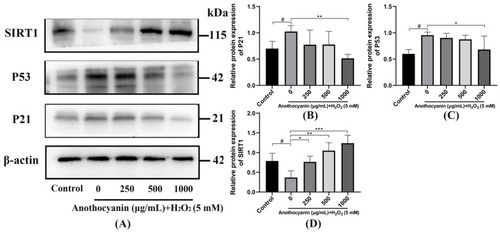
LRA alleviates aging through the SIRT1/P53 signaling pathway. (A) Effect of LRA on SIRT1/P53 protein; (B) Relative quantification of P21 protein. (C) Relative quantification of P53 protein. (D) Relative quantification of SIRT1 protein. Statistical significance: # p < 0.05 vs. Control group; * p < 0.05, ** p < 0.01, *** p < 0.001 vs. H2O2 group.

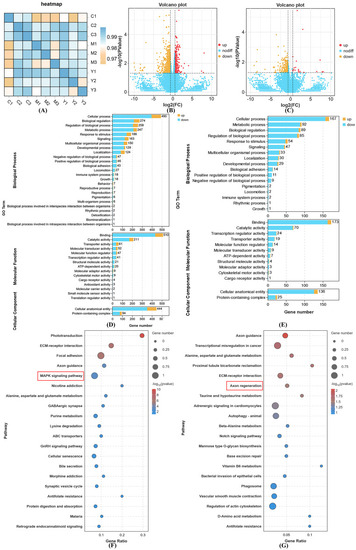
Effect of LRAs on gene expression during H2O2-induced zebrafish aging. (A) The correlation heat map between samples; (B) volcano map of DEGs in the C vs. M group; (C) volcano map of DEGs in the Y vs. M group; (D) GO annotation analysis of DEGs in the C vs. M group; (E) GO annotation analysis of DEGs in the Y vs. M group; (F) KEGG enrichment analysis of DEGs in the C vs. M group; (G) KEGG enrichment analysis of DEGs in the Y vs. M group.

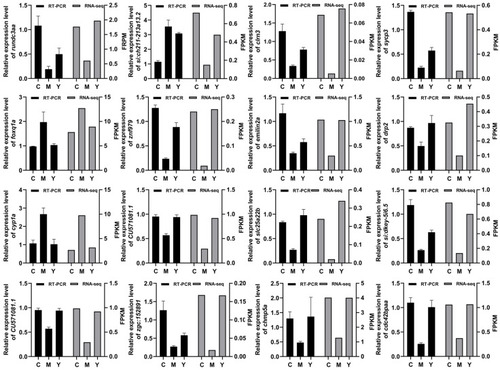
Validation of DEGs by RT-PCR. C represents Control. M represents the H2O2 group. Y represents the LRA group.

Acknowledgments
This image is the copyrighted work of the attributed author or publisher, and ZFIN has permission only to display this image to its users. Additional permissions should be obtained from the applicable author or publisher of the image. Full text @ Int. J. Mol. Sci.