
- Title
-
Samarium Oxide Exposure Induces Toxicity and Cardiotoxicity in Zebrafish Embryos Through Apoptosis Pathway
- Authors
- Liu, Y., Pu, R., Zou, B., Zhang, X., Wang, X., Yin, H., Jin, J., Xie, Y., Sun, Y., Jia, X., Bi, Y.
- Source
- Full text @ J. Appl. Toxicol.
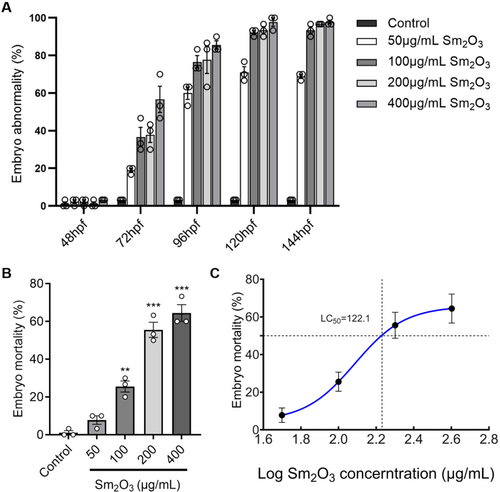
Toxicity of Sm2O3 on zebrafish larvae (n = 30) at 96 hpf. (A) Embryo abnormality (%). (B) Embryo mortality (%) of zebrafish exposed to 50, 100, 200, 400 μg/mL Sm2O3 suspension for 96 hpf. Compared with the control group. **p < 0.01, ***p < 0.001. (C) Toxicity (3d-LC50) of Sm2O3 on zebrafish. |
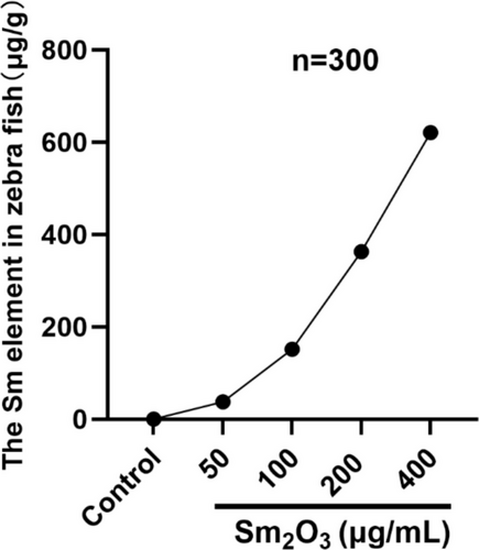
The concentration of Sm in zebrafish (n = 300) with different dose of Sm2O3 .at 96 hpf. |
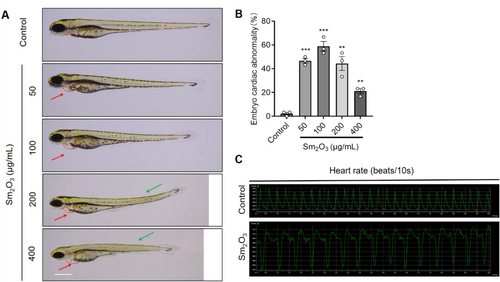
Cardiotoxicity of Sm2O3 on zebrafish larvae (n = 30) at 96 hpf. (A) Malformations of Sm2O3-induced zebrafish embryos. Bright-field and representative images (3×) of zebrafish in Sm2O3 group showed a shortened body length, heart edema (red arrows), microphthalmia (white circle), and spine eminence (green arrows) after exposure to 50, 100, 200, and 400 μg/mL Sm2O3 suspension. (B) Embryo cardiac abnormality of zebrafish exposed to 50, 100, 200, and 400 μg/mL Sm2O3 suspension for 96 hpf. Compared with the control group. **p < 0.01, ***p < 0.001. (C) Representative heart rate in Sm2O3 group zebrafish embryos. |
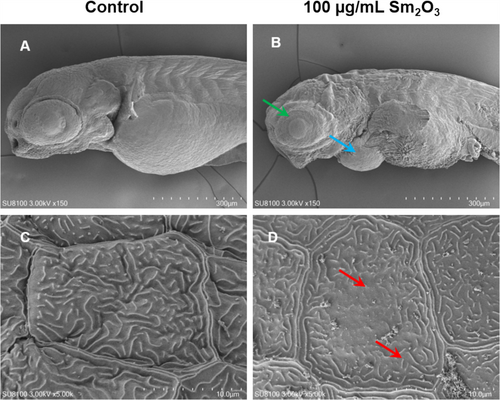
SEM of larvae in control and Sm2O3 treatment group at 96 hpf. (A,C) Control group larvae showed normal surface features and regular skin lines, enlargement of the pericardium (blue arrow), and microphthalmia (green arrow). (B,D) The Sm2O3 treatment group revealed a shrunken shape, shortened, and flattened micro-ridges (red arrow). |

TEM of keratinocyte in control and Sm2O3 treatment group larvae at 96 hpf. (A,A') Membrane protrusion (red arrows) and the cell-to-cell contact (red box) was observed in the control group larvae. (B,B') Shortened or even disappeared protrusions (red arrows) in the experimental group. |
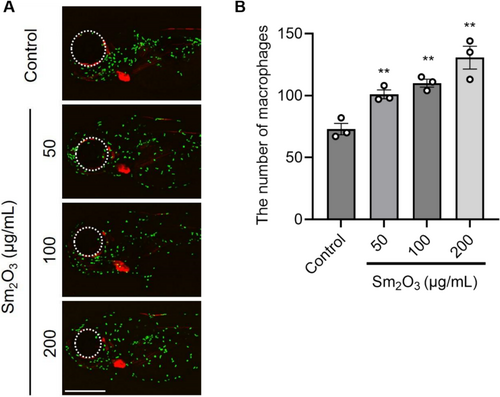
The distribution of macrophages in zebrafish larvae (n = 30). Red fluorescence: ventricle. Green fluorescence: macrophage. White circle: eye. **p < 0.01. Scale bar 50 μm. |
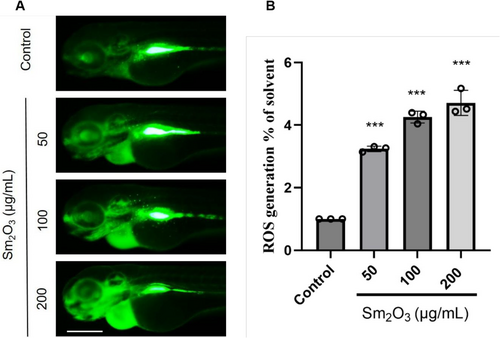
Effects of Sm2O3 on oxidative stress in zebrafish larvae (n = 10). (A) Fluorescence images of ROS in zebrafish larvae exposure with 0, 50,100, and 200 μg/mL Sm2O3 suspension at 96 hpf. Scale bar 50 μm. (B) The statistical analysis of ROS fluorescence intensity at 96 hpf. ***p < 0.001. |

Effect of Sm2O3 on the heart during zebrafish embryogenesis (n = 10). (A) AO staining images, apoptotic cells (AO staining green fluorescent spot) in zebrafish larvae heart. Scale bar 50 μm. (B) Protein expression of cleaved caspase-3, Bax, and Bcl-2 in larvae after exposure to Sm2O3. *p < 0.05, **p < 0.01, ***p < 0.001. |