SEM images (A,B), size distribution (C), and zeta potential (D) of BC.

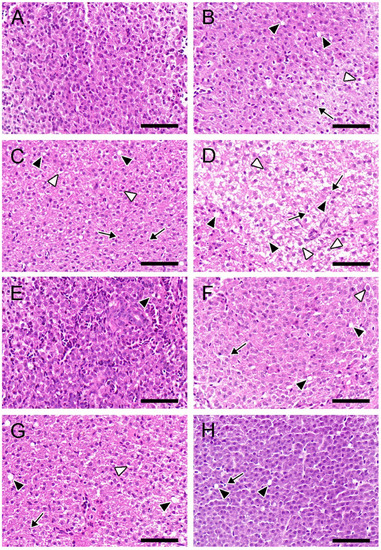
Hepatic H&E-stained sections of zebrafish. Control (A); 1 μg/L MC-LR (B); 5 μg/L MC-LR (C); 25 μg/L MC-LR (D); 100 μg/L BC (E); 1 μg/L MC-LR+ BC (F); 5 μg/L MC-LR + BC (G); and 25 μg/L MC-LR + BC (H). Pyknotic nuclei (black arrow), swollen hepatocytes (white arrowhead), and vacuolization (black arrowhead). Bar = 50 um.

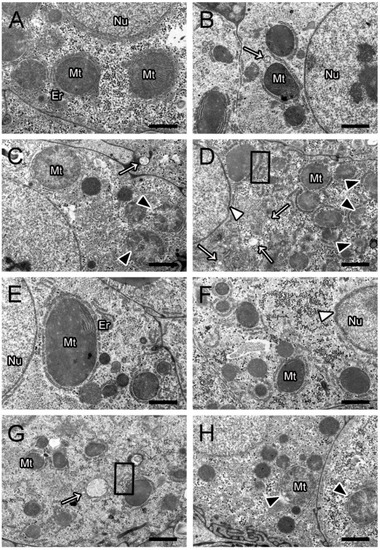
Hepatic ultrastructural alterations in zebrafish. Control (A); 1 μg/L MC-LR (B); 5 μg/L MC-LR (C); 25 μg/L MC-LR (D); 100 μg/L BC (E); 1 μg/L MC-LR + BC (F); 5 μg/L MC-LR+ BC (G); and 25 μg/L MC-LR + BC (H). Swollen mitochondria (black arrowhead); deformed nuclei (white arrowhead); vacuolization (white arrow); and dilated endoplasmic reticulum (black box). Mt, mitochondria; Nu, nuclei; ER, endoplasmic reticulum. Bar = 1 μm.

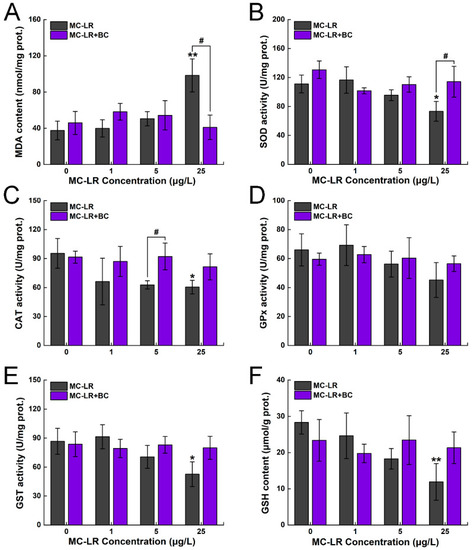
Changes in MDA content (A), SOD activity (B), CAT activity (C), GPx activity (D), GST activity (E), and GSH content (F) in the liver of zebrafish. Asterisks (* p < 0.05; ** p < 0.01) indicate significant differences between the treatments and control. Hashes (# p < 0.05) indicate significant differences between the MC-LR + BC groups and the MC-LR-only groups, respectively. The values are presented as mean ± SD (n = 3).

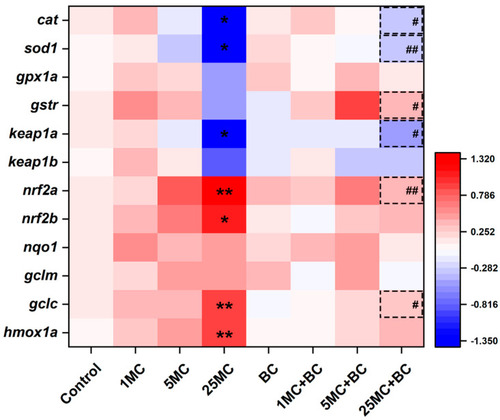
Heatmap of Nrf2 signaling pathway gene expression. Asterisks (* p < 0.05; ** p < 0.01) indicate significant differences between the treatments and control. The dotted box with hashes (# p < 0.05; ## p < 0.01) indicate significant differences between the MC-LR + BC groups and the MC-LR-only groups, respectively. The values are presented as mean ± SD (n = 6).

Acknowledgments
This image is the copyrighted work of the attributed author or publisher, and ZFIN has permission only to display this image to its users. Additional permissions should be obtained from the applicable author or publisher of the image. Full text @ Toxins (Basel)