
- Title
-
DEHP-Induced Glioblastoma in Zebrafish Is Associated with Circadian Dysregulation of PER3
- Authors
- Men, S., Xu, J., Yang, Z., Yan, Z.
- Source
- Full text @ Toxics

PER3 expression is significantly downregulated in several cancers, including GBM. ( |
PER3 expression is significantly downregulated in several cancers, including GBM. ( |

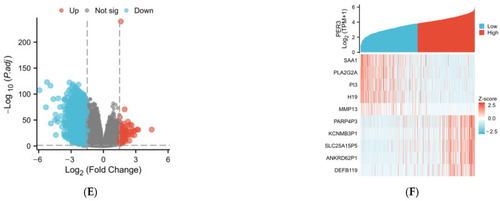
Functional enrichment analysis of differentially expressed genes in GBM based on PER3 expression levels. ( |
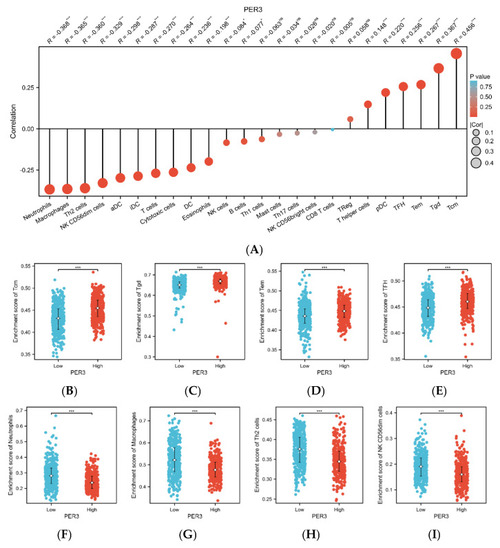
Correlation analysis of immune cell infiltration with PER3 expression in GBM. ( |
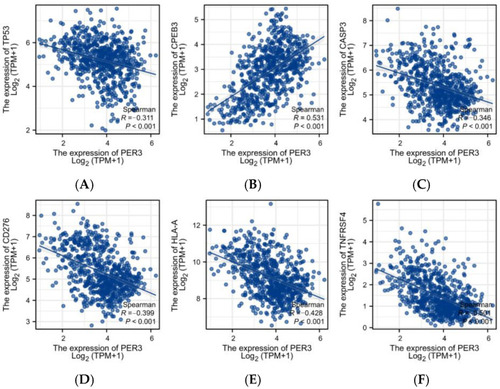
Correlation analysis of PER3 expression level with oncogene ( |
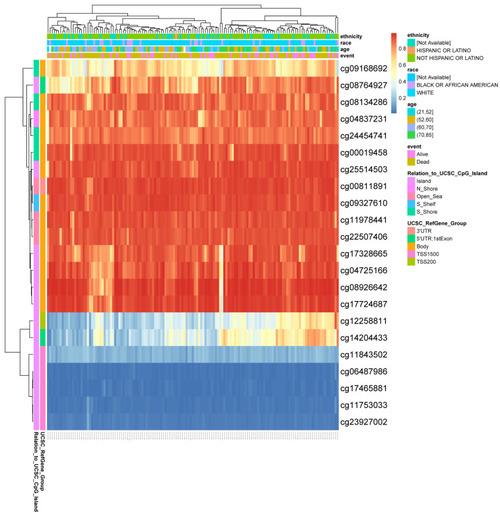
DNA methylation level of PER3 gene is associated with prognosis of GBM. |
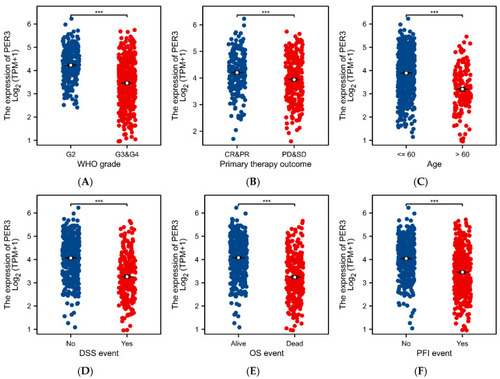
PER3 expression levels correlate with a variety of clinical case characteristics in GBM patients. ( |
PER3 expression levels correlate with a variety of clinical case characteristics in GBM patients. ( |

PER3 exhibits high prognostic predictive value in patients with GBM. k-M plots show the differences in ( |
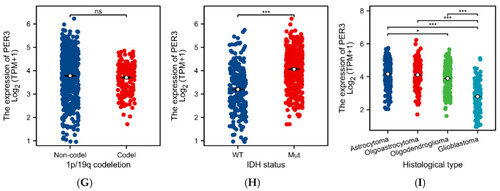
PER3 exhibits excellent diagnostic and prognostic performance in GBM ( |
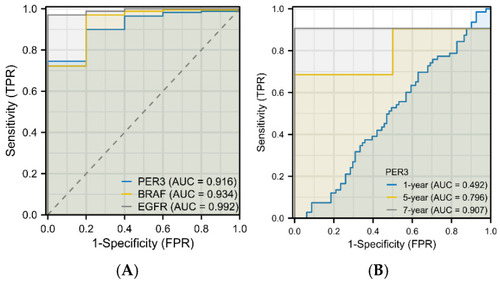
Toxic effects of DEHP on zebrafish. ( |