
- Title
-
Uncovering potential causal genes for undiagnosed congenital anomalies using an in-house pipeline for trio-based whole-genome sequencing
- Authors
- Kim, J.M., Cho, H.W., Shin, D.M., Kim, O.H., Kim, J., Lee, H., Lee, G.H., An, J.Y., Yang, M., Jo, H.S., Jang, J.H., Chang, Y.S., Park, H.Y., Park, M.H.
- Source
- Full text @ Hum. Genomics
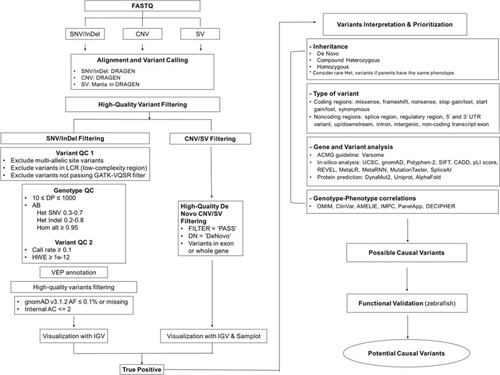
Workflow of congenital anomaly-associated variants discovered using whole genome sequence data |
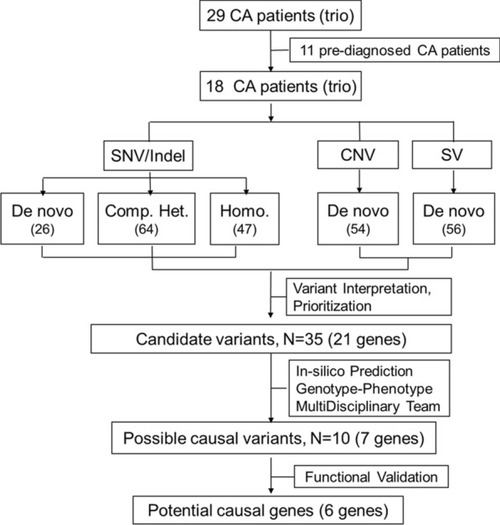
Summary of results from the trio-based WGS analysis of patients with congenital anomaly using the established in-house pipeline. The numbers in parentheses indicate the number of variants |
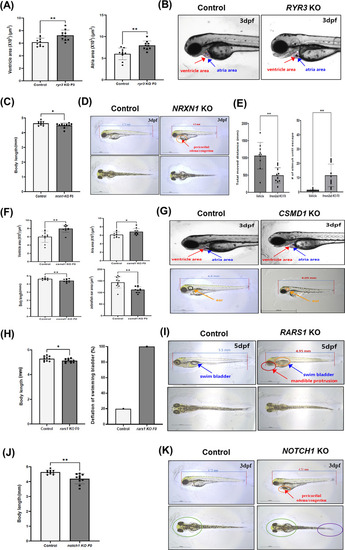
Phenotypic characteristics of zebrafish knockout (KO) models for six genes, including RYR3, NRXN1, FREM2, CSMD1, RARS1, and NOTCH1. A, B Atria and ventricle areas in RYR3 KO zebrafish are larger compared to those in control at 3dpf. The red arrow indicates the area of ventricle and the blue indicates the atria. C, D Compared to that in the control, the body length decreased in the NRXN1 KO model, and some individuals showed pericardial edema/congestion in KO (red arrow). E Compared to that in the control, ‘Total moved distance’ was decreased in the FREM2 KO model (left panel) and ‘the number of stimuli until escape’ increased (right panel). F, G Compared to those in the control, the atria and ventricle sizes in heart were increased (blue and red arrow), the body length was shortened, and ear area was decreased (orange arrow) in the CSMD1 KO model. H, I Body length in the RARS1 KO model is shorter and the swim bladder is not developed compared to that of the control at 5dpf (blue arrow). Some individuals showed mandible protrusion and a short mandible length compared to the control (red arrow). J, K Compared to that in the control, the body length was shortened, the size of head and eye (green circle) decreased in NOTCH1 KO. The KO model showed tail curvature (purple circle) and pericardial edema/congestion (red arrow). The data depict the area of atria and ventricle (A, F), the length of body (B, F, H, J), and the area of ear (F) for each zebrafish individual, with the data plot representing the mean ± SEM (n = 10). Statistical significance was determined using a two-tailed t-test. *p < 0.05; **p < 0.01; ***p < 0.001; dpf, day post-fertilization; SEM, standard error of the mean PHENOTYPE:
|