
FIGURE SUMMARY
- Title
-
Metabolomic Hallmarks of Obesity and Metabolic Dysfunction-Associated Steatotic Liver Disease
- Authors
- Beyoğlu, D., Popov, Y.V., Idle, J.R.
- Source
- Full text @ Int. J. Mol. Sci.
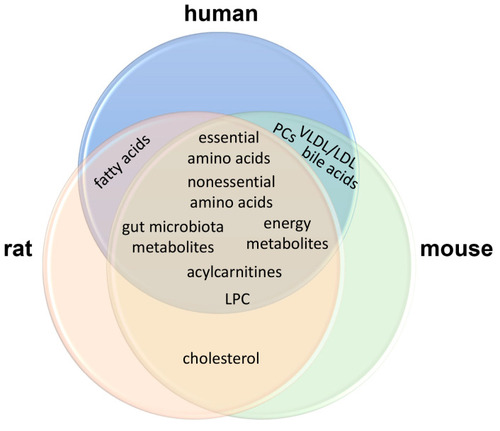
Venn diagram showing the shared elevated obesity metabolomic biomarker groups in human, rat, and mouse. |
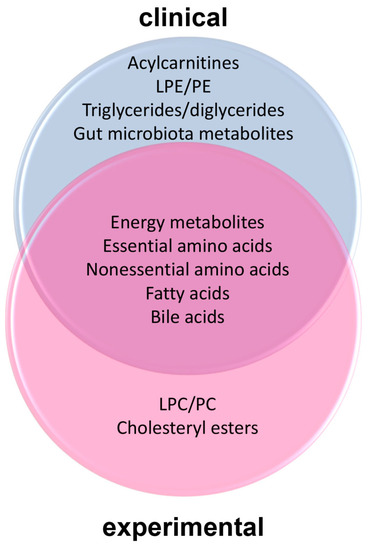
Venn diagram showing the shared elevated MASLD biomarker groups between clinical and experimental studies. |
Acknowledgments
This image is the copyrighted work of the attributed author or publisher, and
ZFIN has permission only to display this image to its users.
Additional permissions should be obtained from the applicable author or publisher of the image.
Full text @ Int. J. Mol. Sci.