FIGURE SUMMARY
Title

Cellular retinoic acid binding proteins regulate germ cell proliferation and sex determination in zebrafish

Authors
Fung, L., Dranow, D.B., Subramanian, A., Libby, N., Schilling, T.F.
Source
Full text @ Development

Crabp2 mutants are disproportionately male and have smaller gonads. (A) Schematic of the four Crabp1 and Crabp2 genes. Red arrowhead indicates the exon 2 gRNA target site. Selected sequences depict Crabp1 and Crabp2 wild-type gRNA target sites in bold and corresponding mutant alleles for crabp1a, crabp1b, crabp2a and crabp2b. (B) Histogram displaying sex ratios in wild types (male, n=77; female, n=57), crabp1a−/−; crabp1b−/− double mutants (male, n=51; female, n=52) and crabp2a−/−; crabp2b−/− double mutants (male, n=88; female, n=5). (C-H′) Representative images of 12 dpf (C-D′), 24 dpf (E-F′) and adult (G-H′) gonads in wild types and crabp2a−/−; crabp2b−/− double mutants. (C-H) Anti-Ddx4 antibody-labeled germ cells (GCs) are green; DAPI-labeled nuclei are blue. (C′-H′) Grayscale DAPI. (C-D′) Z-projections; (E-H′) single slices. Oo, oogonia; IAZ, zygotene stage IA oocyte; IAP, pachytene stage IA oocyte; Sg, spermatogonia; Sc, spermatocytes; Sz, spermatozoa. GC staging according to Draper (2012) and Selman et al. (1993). Scale bars: 20 μm. Wild type: 12 dpf, n=4 larvae; 24 dpf, n=4 fish; adult, n=8 fish. crabp2a−/−; crabp2b−/−mutants: 12 dpf, n=4 larvae; 24 dpf, n=5 fish; adult, n=6 fish.

Germ cells are retinoic acid responsive during early gonad development. (A-H) Representative confocal images of 12 (A-D) and 23 (E-H) dpf wild-type gonads in Tg(RARE:YFP) transgenics. (I-L) Representative confocal images of a 13 dpf wild-type gonad from a Tg(piwil1:EGFP) transgenic stained using anti-Crabp2a antibody. (A,E) YFP-labeled RA-responsive cells are green; anti-Ddx4 antibody labeled germ cells (GCs) are red. (I) EGFP-labeled piwil1+ GCs are green; Crabp2a-expressing cells are red. (A,E,I) DAPI-labeled nuclei are blue. (B,F) Grayscale Ddx4, (C,G) YFP, (J) EGFP, (K) Crabp2a and (D,H,L) DAPI. (A-D,I-L) Z-projections. (E-H) Single slices. Scale bars: 50 μm. Wild type: 12 dpf, n=3 larvae; 23 dpf, n=1 fish; 13 dpf, n=1 fish. Both gonads from each fish were imaged.

Crabp2 mutant gonads have fewer germ cells and decreased germ cell proliferation. (A-P) Representative confocal z-projections of BrdU incorporation at 7 (A-H) and 12 (I-P) dpf in gonads of wild type and crabp2a−/−; crabp2b−/− double mutants. (A,E,I,M) Anti-Ddx4 antibody-labeled germ cells (GCs) are green; BrdU-labeled proliferating cell nuclei are red; DAPI-labeled nuclei are blue. (B,F,J,N) Grayscale Ddx4; (C,G,K,O) BrdU; (D,H,L,P) DAPI. Insets show magnified views of regions of interest in GCs (outlined). Arrowheads indicate GC nuclei showing BrdU incorporation. (Q) Violin, and box and whisker plots depicting GC numbers at 7 and 12 dpf. Each datapoint represents total GC number per gonad. At 7 dpf, crabp2a−/−; crabp2b−/− double mutants and wild types are similar (P=0.1775). At 12 dpf, crabp2a−/−; crabp2b−/− double mutants have significantly fewer GCs than wild types (P=0.0001). (R) Violin, and box and whisker plots depicting the percentages of proliferating GCs at 7 and 12 dpf. Each datapoint represents the number of BrdU+ GCs per gonad. At 7 dpf, crabp2a−/−; crabp2b−/− double mutants and wild types are similar (P=0.4507). At 12 dpf, crabp2a−/−; crabp2b−/− double mutants have significantly fewer BrdU+ GCs compared to wild types (P=0.0424). An unpaired two-tailed t-test was used to test for significance (*P<0.05; ***P<0.0001; n.s., no significance). Violin plots: wild type, gray bars; crabp2a−/−; crabp2b−/− double mutants, white bars. The box represents the interquartile range (IQR) where 50% of the data points are present. The height of the box is inversely proportional to the clustering of the measurements. Outliers are present outside the box and quartiles. The horizontal line in the box plot represents the median. Scale bars: 50 μm (25 μm in insets). Wild type: 7 dpf, n=3 larvae; 12 dpf, n=7 fish. crabp2a−/−; crabp2b−/−mutants: 7 dpf, n=3 larvae; 12 dpf, n=8 fish.

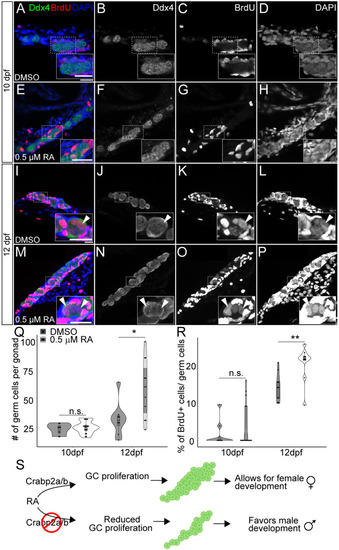
Retinoic acid promotes germ cell proliferation during gonad development. (A-H) Representative confocal z-projections of BrdU incorporation between 9 and 10 (A-H), and 11 and 12 (I-P) dpf in gonads of DMSO vehicle- (A-D,I-L) or 0.5 µM RA- (E-H,M-P) treated animals. Anti-Ddx4 labeled germ cells (GCs) are green; BrdU-labeled proliferating cell nuclei are red (A,E,I,M). (B,F,J,N) Grayscale Ddx4; (C,G,K,O) BrdU; (D,H,L,P) DAPI. Insets show magnified views of regions of interest in GCs (outlined). Arrowheads indicate GC nuclei showing BrdU incorporation. (Q) Violin, and box and whisker plots depicting the GC number per gonad at 10 and 12 dpf. Each datapoint represents the total GC number in one gonad. At 10 dpf, DMSO- and 0.5 µM RA-treated animals were similar (P=0.4930). At 12 dpf, DMSO-treated animals had significantly fewer GCs than 0.5 µM RA-treated animals (P=0.0182). (R) Violin, and box and whisker plots depicting percentages of proliferating GCs at 10 and 12 dpf. Each datapoint represents BrdU+ GC numbers per gonad. At 10 dpf, most DMSO- and 0.5 µM RA-treated animals showed no BrdU+ GCs (P=0.4209). At 12 dpf, DMSO-treated animals had significantly fewer BrdU+ GCs compared to 0.5 µM RA-treated animals (P=0.0044). An unpaired two-tailed t-test was used to test for significance (*P<0.05; **P<0.01; n.s., no significance). (S) Schematic for proposed roles of RA and Crabp2 proteins in regulating GC development and sex differentiation. Violin plots: DMSO treatments, gray bars; 0.5 µM RA, white bars. The box represents the interquartile range (IQR) where 50% of the data points are present. The height of the box is inversely proportional to the clustering of the measurements. Outliers are present outside the box and quartiles. The horizontal line in the box plot represents the median. Scale bars: 20 μm. DMSO: 10 dpf, n=3 larvae; 12 dpf, n=7 fish. RA treated: 10 dpf, n=3 larvae; 12 dpf, n=8 fish.

Retinoic acid function regulates meiotic entry in adult testes. (A-F) Representative confocal z-slices showing dmc1 mRNA expression in adult testes from wild type (A-C) and crabp2a−/−; crabp2b−/− double mutants (D-F) using isHCR. dmc1-expressing germ cells (GCs) are labeled in green (A,D). (C,F) Grayscale; nuclei are stained with DAPI in grey (B,E) and blue (A,D). (G) Violin, and box and whisker plot depicting the number of GCs in a gonad expressing dmc1. Each data point represents the total number of GCs in a single dmc1-expressing cluster. Four regions were imaged per gonad and gonads from four adults were imaged for wild type and mutants. An unpaired two-sample Wilcoxon test was performed (*P=0.02). The box represents the interquartile range (IQR) where 50% of the data points are present. The height of the box is inversely proportional to the clustering of the measurements. Outliers are present outside the box and quartiles. The horizontal line in the box plot represents the median. Scale bar: 20 μm.

Acknowledgments
This image is the copyrighted work of the attributed author or publisher, and ZFIN has permission only to display this image to its users. Additional permissions should be obtained from the applicable author or publisher of the image. Full text @ Development