
- Title
-
Image response-assisted volumetric reconstruction for simultaneous multi-color light-field microscopy
- Authors
- Yang, Y., Xing, Y., Jin, X.
- Source
- Full text @ Opt. Express
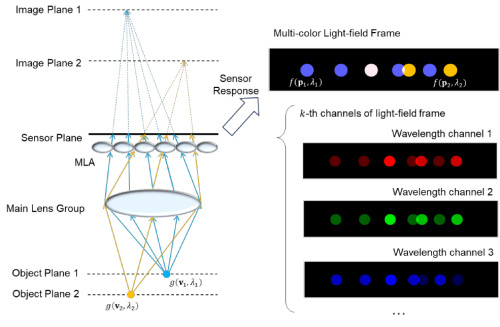
The figure illustrates the propagation and sensor response of a multi-color light-field frame, with different colors representing various fluorophores. The varying numbers of images correspond to different depths of information The mixed color in the multi-color light-field frame indicates positional cross-talk. |
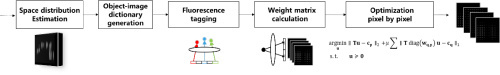
The flowchart of the realization of unmixing. |
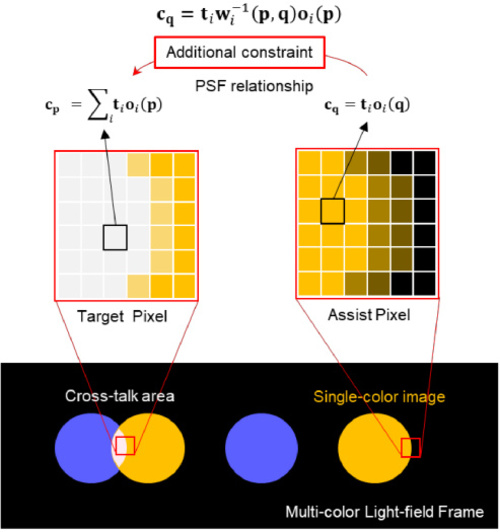
The principle of the image response-assisted unmixing method. |

Unmixing results and residuals of the proposed unmixing and other methods in four-color simulation in SNR equals Inf dB (a) and 25 dB (b). The headline indicates the colors of the fluorescence and their corresponding emission peaks, while the first column presents the results of the methods under different noise levels. Scale Bar: 2 ?m. |

Multi-color volumetric reconstruction results on ??? view and the residuals of the proposed method and comparison methods in four-color simulation. Two details of the slices are magnified. SNR equals to Inf dB (a) and 25 dB (b) are shown. Scale bar of volumetric reconstruction: 10 ?m. |

The results of ablation simulation of unmixing (a), the residuals of unmixing (b) and the slices on ??? plane of multi-color volumetric reconstruction and their residuals(c). For (c), the first row shows the direct results and the second row shows the residuals. Scale bar of unmixing: 2 ?m; scale bar of volumetric reconstruction: 20 ?m; scale bar of magnified images: 5 ?m. |
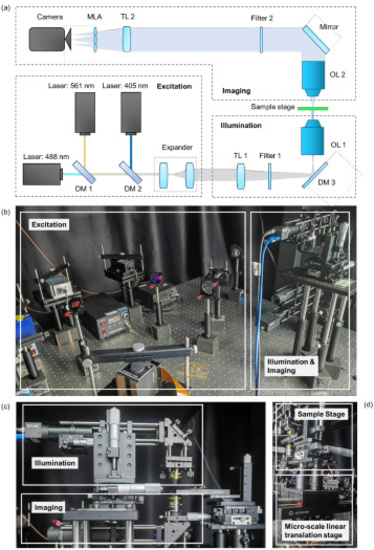
The layout (a) and photos (b?d) of the system are shown. In (a), DM means dichroic mirror, TL means tube lens, OL means objective lens, and MLA is the micro-lens array. Photo (b) provides an overview of the three parts of the system. (c) shows the construction of the illumination and imaging parts; (d) shows the relationship between the sample stage and the micro-scale linear translation stage. |
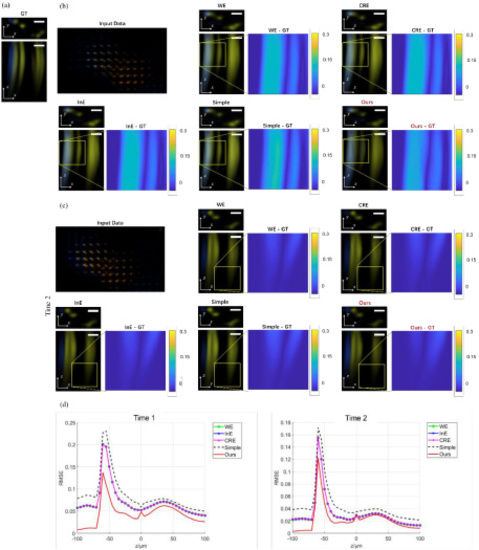
The result of the moving particle experiment. The depth slice where ? = + 35 ?m, the volume from ??? , and magnified residual images of them are shown. (a) shows the GT from ? = +5 ?m to ? = + 100 ?m. (b) and (c) shows the results from ? = +5 ?m to ? = + 100 ?m reconstructed from frames of Time 1 and Time 2, respectively. The curves show the average RMSE of each depth slice from ? = -100 ?m to ? = + 100 ?m of all methods. Scale bar: 20 ?m. |

The result of the moving particle experiment. The depth slice where ? = + 35 ?m, the volume from ??? , and magnified residual images of them are shown. (a) shows the GT from ? = +5 ?m to ? = + 100 ?m. (b) and (c) shows the results from ? = +5 ?m to ? = + 100 ?m reconstructed from frames of Time 1 and Time 2, respectively. The curves show the average RMSE of each depth slice from ? = -100 ?m to ? = + 100 ?m of all methods. Scale bar: 20 ?m. |
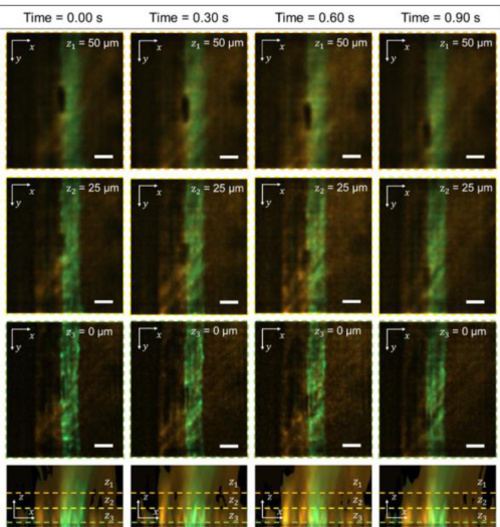
The reconstruction of depth slices and the max ??? intensity projection of static zebrafish larvae experiment. Volumes of two types of fluorescence are added to obtain multi-color volumes. The headline indicates the moment. The last line indicates the max intensity projection. Scale bar: 40 ?m. |