
- Title
-
Deficiency of leap2 promotes somatic growth in zebrafish: Involvement of the growth hormone system
- Authors
- Guan, K., Ye, M., Guo, A., Chen, X., Shan, Y., Li, X.
- Source
- Full text @ Heliyon
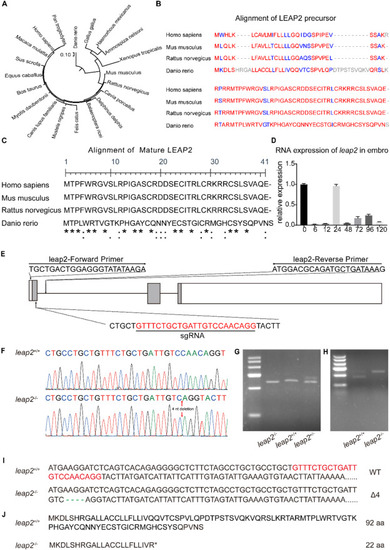
Generation of leap2-deficient zebrafish. (A) Phylogenetic tree of LEAP2. (B) Multiple sequence alignment columns with no gaps are colored in blue or red of LEAP2 precursor. The red color indicates highly conserved columns and blue indicates less conserved ones. (C) Alignment of mature LEAP2, complete conservation is marked with "∗", molecules with roughly similar sizes and the same hydrophilicity and hydrophobicity are marked with ":", and residues whose molecular size and hydrophobicity are preserved to a certain extent are marked with "." (D) Relative expression levels of leap2 in various stages of zebrafish embryos. (E) Specific guide RNA (sgRNA) site is targeted in the first exon of leap2. (F) Electropherogram of Sanger DNA sequencing for leap2+/+ and leap2−/− zebrafish. (G) The gel electrophoresis of PCR products spanning mutated sites from mutant (−/−), wild type (+/+) and heterozygous (±). (H) The PCR products of leap2+/+ and leap2−/− zebrafish were digested by MmeI. (I) Comparison of DNA sequences identified in leap2+/+ and leap2−/− zebrafish lines. (J) The alignment of predicted protein sequences in leap2+/+ and l leap2−/− zebrafish lines. (For interpretation of the references to color in this figure legend, the reader is referred to the Web version of this article.) |
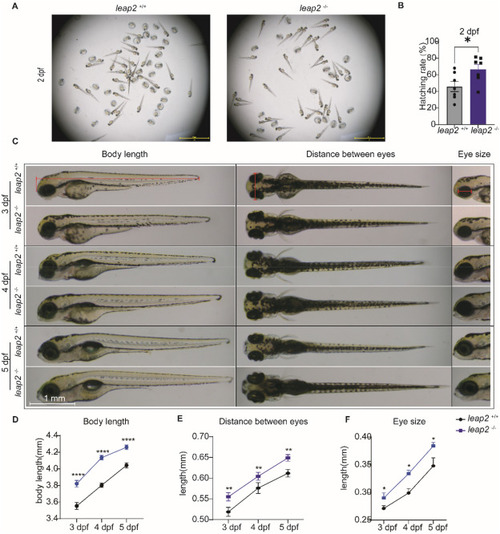
The growth and developmental process of leap2−/− mutant zebrafish is accelerated. (A) Representative image of embryo hatching and hatchability at 2 dpf, scale bar = 5 mm. (B) Hatching rate of 2 dpf leap2+/+ and leap2−/− zebrafish larvae. (C) Representative picture of whole body of zebrafish larvae (side view), zebrafish larvae (top view) and eyes. (D) Body length of 3 dpf, 4 dpf, 5 dpf zebrafish larvae, (E) the distance between eyes and (F) Eye size of zebrafish larvae was measured, scale bar = 1 mm, Data analysis was performed using Student t-test, ∗p < 0.05 ∗∗p < 0.01, ∗∗∗∗p < 0.0001. |
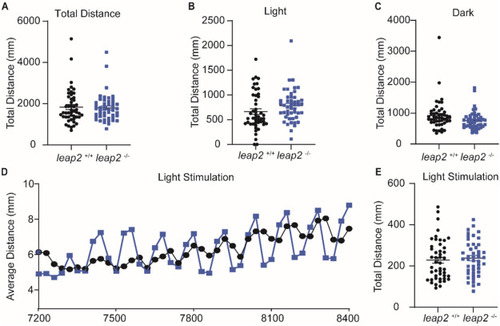
Locomotor behavior of 5 dpf zebrafish larvae. Total locomotor activity distance in 2 h and 20 min(A), 1-h light phase (B), 1-h dark phase (C). (D) Behavioral patterns under 20 min of light/dark cycle stimulation. (E) Swimming distance under light/dark cycle stimulation. N = 48. Data analysis was performed using Student t-test. PHENOTYPE:
|
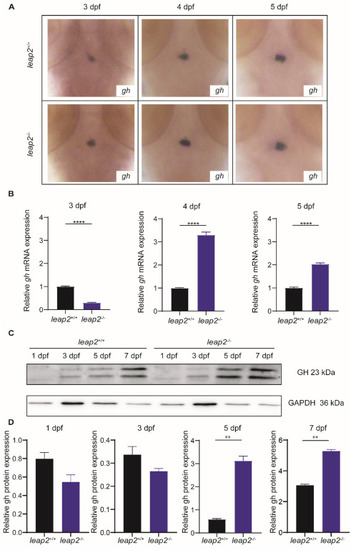
Deletion of leap2 results in increased gh expression in zebrafish larvae. (A) Representative images whole-mount zebrafish embryo in situ hybridization. (B) Relative expression of gh in 3 dpf, 4 dpf and 5 dpf of zebrafish larvae. (C) Western blot detection GH protein expression. (D) Relative gh protein expression of zebrafish larvae. Data analysis was performed using Student t-test. ∗∗∗∗p < 0.0001. EXPRESSION / LABELING:
PHENOTYPE:
|
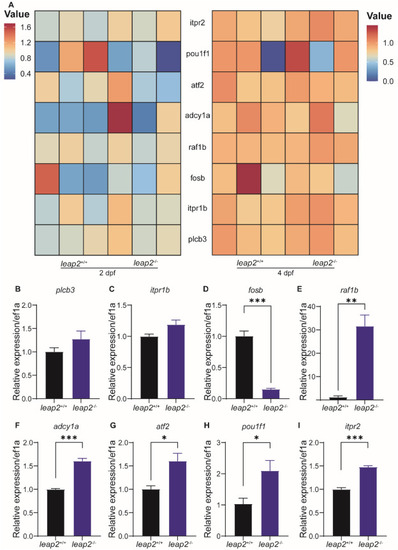
Changes in GH signaling pathway in leap2-deficient zebrafish larvae. (A) Heat map of gene expression related to gh signaling pathway by transcriptome sequencing. (B–I) Relative expression levels of genes related to gh signaling pathway in 5 dpf zebrafish larvae. Data analysis was performed using Student t-test. ∗P < 0.05, ∗∗P < 0.01, ∗∗∗∗p < 0.0001. |

Unillustrated author statements PHENOTYPE:
|