- Title
-
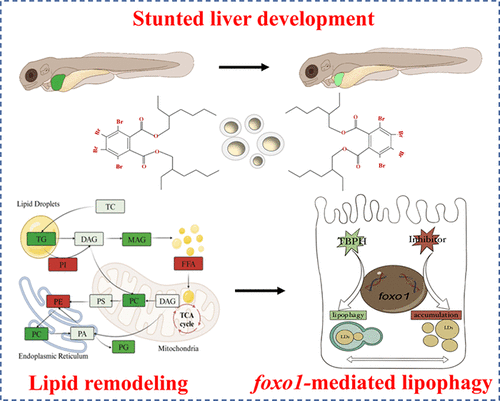
Bis(2-ethylhexyl)-2,3,4,5-tetrabromophthalate Enhances foxo1-Mediated Lipophagy to Remodel Lipid Metabolism in Zebrafish Liver
- Authors
- Zhou, Y., Li, F., Fu, K., Zhang, Y., Zheng, N., Tang, H., Xu, Z., Luo, L., Han, J., Yang, L., Zhou, B.
- Source
- Full text @ Env. Sci. Tech.
|
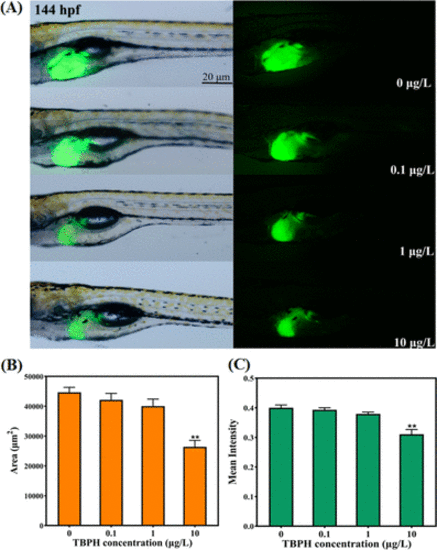
Effects of TBPH on liver development of zebrafish larvae. (A) Representative photos for liver morphogenesis of Tg (Apo14: GFP) transgenic zebrafish larvae at 144 hpf. (B) Fluorescence area and (C) mean fluorescence intensity in transgenic zebrafish. Data are expressed as the mean ± SEM. *P < 0.05 and **P < 0.01 indicate significant differences between the exposure groups and their corresponding control. |
|
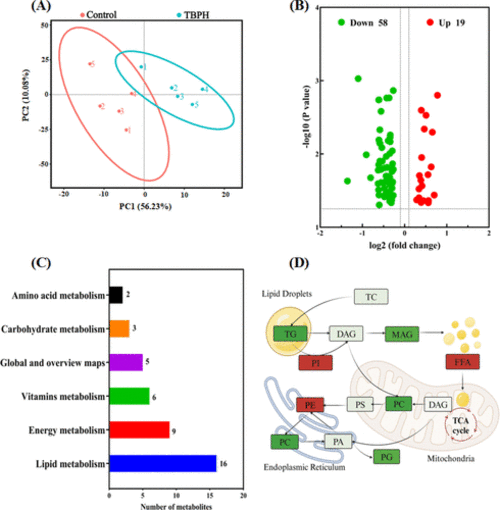
Lipidomic analysis in zebrafish larvae after exposure to TBPH. (A) PCA plots. (B) Volcano plots. (C) Number of metabolites enriched on KEGG pathways. (D) Coregulatory network of lipid subclasses. The red and green colors represent increased and decreased lipid subclasses, respectively, and the intensity represents the P value. |
|
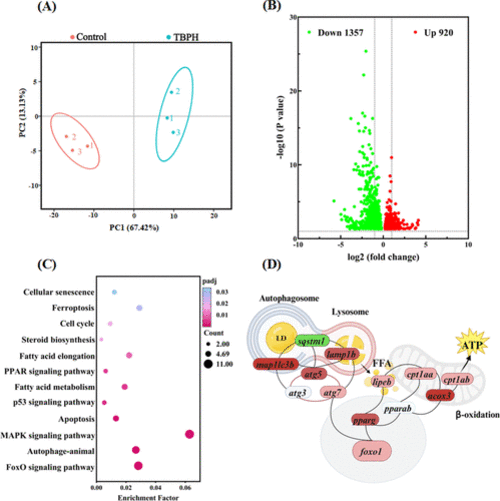
Transcriptomic analysis in zebrafish larvae after exposure to TBPH. (A) PCA plots. (B) Volcano plots. (C) KEGG enrichment. (D) Coregulatory network of DEGs. The red, green, and white ellipses represent upregulation, downregulation, and no significant changes, respectively. The color intensity represents the P value. foxo1: forkhead box O1; pparg and pparab: peroxisome proliferator-activated receptor gamma and alpha b; lc3 (map1lc3bm): map1lc3bmicrotubule-associated protein 1 light chain 3 beta; atg3,5,7: autophagy related 3,5,7; sqstm1: sequestosome 1; lamp1b: lysosomal associated membrane protein 1b; lipeb: lipase, hormone-sensitive b; cpt1aa and cpt1ab: carnitine palmitoyltransferase 1Aa and 1Ab; acox3: acyl-CoA oxidase 3, pristanoyl. |
|
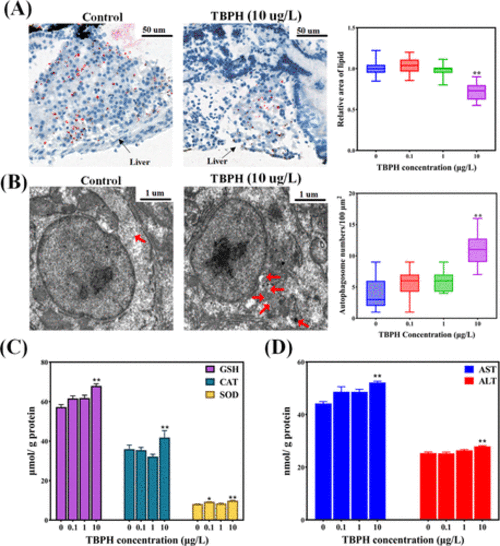
TBPH enhances hepatic lipid degradation and hepatoxicity. (A) Oil Red O staining of the liver sections. (B) TEM images and autophagic vesicle quantification. Red arrows mark the autophagic vesicles. (C) Oxidative stress induced by TBPH. (D) AST and ALT activity. Data are expressed as mean ± SEM. *P < 0.05 and **P < 0.01 indicate significant differences between the exposure group and the control group. |
|
|

