
- Title
-
A comprehensive assessment of palmatine as anticonvulsant agent - In vivo and in silico studies
- Authors
- Nieoczym, D., Marszalek-Grabska, M., Szalak, R., Kundap, U., Kaczor, A.A., Wrobel, T.M., Kosheva, N., Komar, M., Abram, M., Esguerra, C.V., Samarut, E., Pier�g, M., Jakubiec, M., Kaminski, K., Kukula-Koch, W., Gawel, K.
- Source
- Full text @ Biomed. Pharmacother.
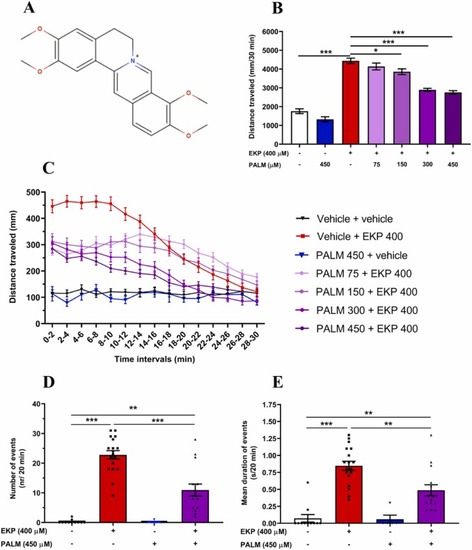
Chemical structure of PALM (A) and PALM effect in the EKP-induced hyperlocomotion assay in larval zebrafish. Zebrafish larvae (6 dpf) were incubated with PALM (75, 150, 300 or 450 �M) for 24 h and then exposed to EKP (400 �M). The analysis started 5 min after EKP application. Results of the experiments are shown as: (B) total distance traveled during 30 min of experiment, (C) distance traveled in 2 min long time bins, (D) number of events [nr/20 min] and (e) mean duration of events [s/20 min] in the LFP recordings. Two-way ANOVA with repeated measures with Bonferroni?s post-hoc test (A) and one-way ANOVA with Tukey?s post hoc test (B) were applied for statistical purposes. Data are shown as mean � SEM. Behavioural studies (B, C): vehicle + vehicle, n = 33; PALM 450 + vehicle, n = 28; vehicle + EKP, n = 91; PALM 75 + EKP, n = 48; PALM 150 + EKP, n = 48; PALM 300 + EKP, n = 37; PALM 450 + EK; n = 87; LFP recordings (D, E): vehicle + vehicle, n = 11; PALM 450 + vehicle, n = 5; vehicle + EKP, n = 18; PALM 450 + EKP 400, n = 15. * p < 0.05, * * p < 0.01, * ** P < 0.001. EKP ? ethyl 2-ketopent-4-enoate, PALM ? palmatine. |
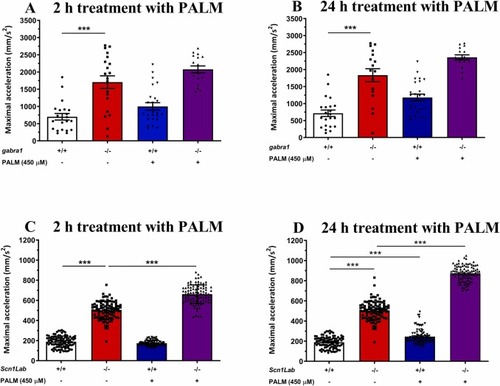
PALM?s effect on the seizure-like behavior of gabra1-/- and scn1Lab-/- zebrafish mutants. Zebrafish larvae (4 or 5 dpf, respectively) were incubated for 2 or 24 h with PALM at a concentration of 450 �M. Results are displayed as maximum acceleration � SEM [mm/s2]. Data were assessed via one-way ANOVA and Tukey?s post-hoc test. *p < 0.05, * **p < 0.001. 2 h treatment: gabra1+/+, n = 24;, gabra1-/-, n = 20; gabra1+/+ + PALM 450, n = 24; gabra1-/- + PALM 450, n = 20; 24 h treatment: gabra1+/+, n = 23; gabra1-/-, n = 17; gabra1+/+ + PALM 450, n = 24; gabra1-/- + PALM 450, n = 17; 2 h treatment: scn1Lab+/+, n = 96; scn1Lab-/-, n = 96; scn1Lab+/+ + PALM 450, n = 96; scn1Lab-/- + PALM 450, n = 96; 24 h treatment: scn1Lab+/+, n = 96; scn1Lab-/-, n = 97; scn1Lab+/+ + PALM 450, n = 97; scn1Lab-/- + PALM 450, n = 97. PALM ? palmatine. |
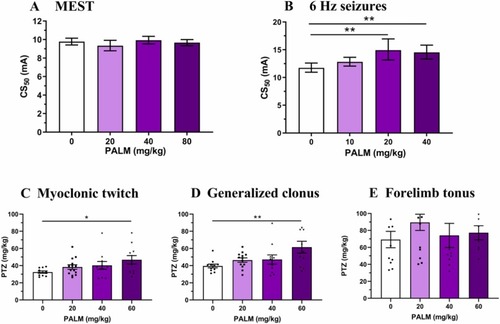
PALM?s effect upon the seizure threshold in the MEST (A), 6 Hz-induced psychomotor seizure threshold (B) and timed iv infusion PTZ (C-E) tests in mice. PALM was given ip 30 min prior to the respective seizure test at doses between 10?80 mg/kg. Each experimental group in the MEST and 6 Hz psychomotor seizure tests consisted of 20 animals, while in the iv PTZ test, experimental groups included 8?14 mice. Results from the MEST and 6 Hz seizure tests are presented in the form of median current strengths (CS50 in mA) with their 95% confidence limits as the error bars, while the iv PTZ test results are shown as mean � SEM. One-way ANOVA and Dunnett?s multiple comparison test was applied for data analysis; * p < 0.05, * * p < 0.01. |
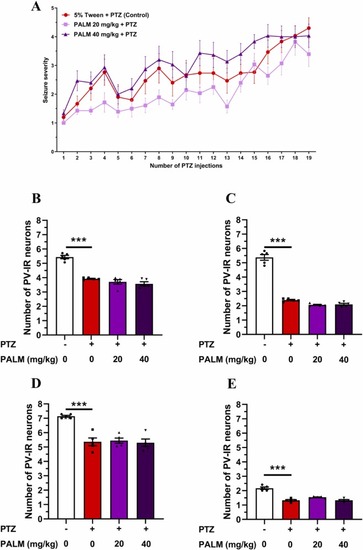
Repeated treatment with PALM on the seizure severity (A) and loss of PV-IR neurons (B-E) in the hippocampal fields and DG of PTZ kindled mice (B-CA1; C-CA2; D-CA3 and E-DG). PTZ was given ip at a dose of 35 mg/kg, three times a week (at least 48 h break between treatment). Total number of PTZ injections was 19. PALM (20 and 40 mg/kg) was given ip 30 min prior to PTZ treatment. Control group received 5% Tween + PTZ. Data are shown as means � SEM, n = 14?15 mice/group. Seizure severity in the respective experimental groups was analysed using two-way ANOVA with repeated measures followed by Dunnett?s multiple comparison test. Immunohistochemical analyses were compared via one-way ANOVA and Dunnett?s post hoc test. * ** p < 0.001 vs. 5% Tween + PTZ-treated group. |
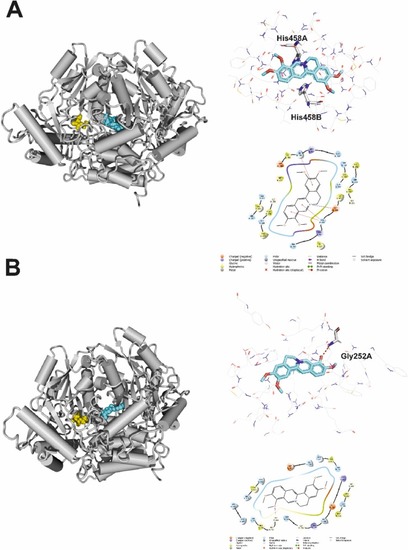
Molecular interactions of PALM with GAD65 (A) and GAD67 (B): protein overview and 3D and 2D visualizations of the binding sites. Protein is shown in grey cartoon or wire representation. EKP is shown in yellow ball representation. PALM is shown in cyan ball representation or in stick representation with cyan carbon atoms. Most important protein residues are shown in stick representation. Hydrogen bonds are seen as red dashed lines. |
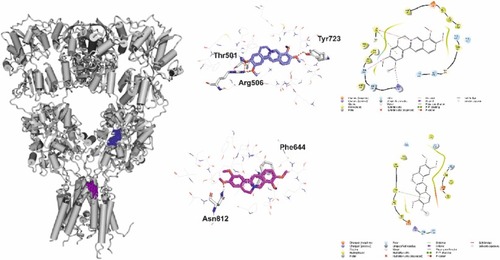
Molecular interactions of PALM with AMPA receptor as indicated by molecular docking: receptor overview and 3D and 2D visualizations of the binding sites. Protein is shown in grey cartoon or wire representation. PALM bound to a competitive site is shown in blue ball representation or in stick representation with blue carbon atoms. PALM bound to a non-competitive site is shown in magenta ball representation or in stick representation with magenta carbon atoms. Important protein residues are shown via stick representation. Hydrogen bonds are indicated as red dashed lines. |