
- Title
-
Variants in ZFX are associated with an X-linked neurodevelopmental disorder with recurrent facial gestalt
- Authors
- Shepherdson, J.L., Hutchison, K., Don, D.W., McGillivray, G., Choi, T.I., Allan, C.A., Amor, D.J., Banka, S., Basel, D.G., Buch, L.D., Carere, D.A., Carroll, R., Clayton-Smith, J., Crawford, A., Dunø, M., Faivre, L., Gilfillan, C.P., Gold, N.B., Gripp, K.W., Hobson, E., Holtz, A.M., Innes, A.M., Isidor, B., Jackson, A., Katsonis, P., Amel Riazat Kesh, L., Genomics England Research Consortium, Küry, S., Lecoquierre, F., Lockhart, P., Maraval, J., Matsumoto, N., McCarrier, J., McCarthy, J., Miyake, N., Moey, L.H., Németh, A.H., Østergaard, E., Patel, R., Pope, K., Posey, J.E., Schnur, R.E., Shaw, M., Stolerman, E., Taylor, J.P., Wadman, E., Wakeling, E., White, S.M., Wong, L.C., Lupski, J.R., Lichtarge, O., Corbett, M.A., Gecz, J., Nicolet, C.M., Farnham, P.J., Kim, C.H., Shinawi, M.
- Source
- Full text @ Am. J. Hum. Genet.
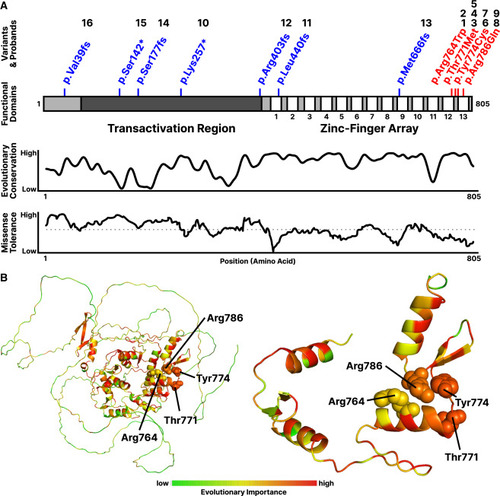
Cohort variants and existing characterization of ZFX (A) Distribution of cohort variants throughout the ZFX coding sequence, with missense variants in red and truncating variants in blue (numbers indicate the corresponding probands). Evolutionary sequence conservation shown for ZFX across 19 vertebrate species.53 Missense tolerance ratios (MTRs) are calculated from gnomAD v2.0 exomes; dotted line indicates 50th percentile for MTR.54. (B) Evolutionary Action scores superimposed on a predicted ZFX structure, with residues colored proportional to evolutionary importance. |
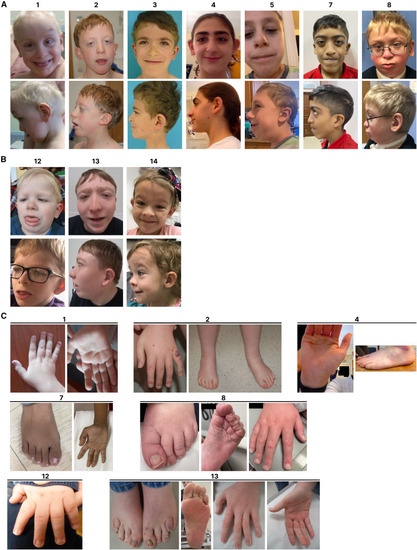
Facial features of the presented individuals with ZFX variants (A) Subjects with missense variants in the ZFX DNA binding domain. (B) Subjects with truncating ZFX variants. (C) Extremities of the indicated subjects. See supplemental information and Table S1 for additional details; images not available for all individuals. |
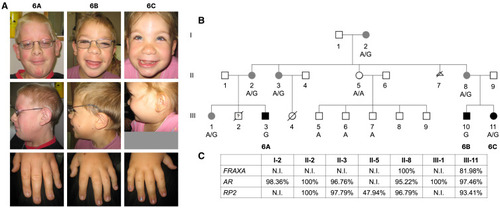
Characterization of a family with an inherited ZFX variant (A) Facial features and extremities of probands 6A–6C (see text and supplemental information for additional details). (B) Three-generation pedigree of probands 6A–6C and family members. Dark black circles and squares indicate affected individuals; gray circles indicate carrier females diagnosed with hyperparathyroidism (except for III-1). A is the wild-type ZFX allele; G is the variant ZFX allele at same position (GRCh38 chrX: 24229396A>G, c.(2438A>G), p.Tyr774Cys). (C) Results of X-inactivation studies showing skewing in all carrier females and random inactivation in a noncarrier female (II-5). |

Characterization of wild-type and missense ZFX DNA binding by ChIP-seq (A) Shown is a browser track displaying the genomic binding patterns of WT and variant ZFX proteins in a representative 2.4k-kb region of chromosome 22. (B) Proportional Venn diagram of overlaps among the top 12,000 called peaks within 2 kb of the transcription start site (TSS) for WT and variant ZFX proteins. The number of peaks common to all ZFXs is indicated. (C) Shown are the DNA binding profiles of WT and variant ZFX proteins from −2 kb to +2 kb from the TSS. |

Characterization of differential expression in the context of missense ZFX variants (A) Gene expression changes following transfection of WT or variant ZFX proteins into DKO cells. Volcano plots show gene expression changes in cells transfected with plasmids expressing the indicated ZFX compared to transfection with the vector alone. RNAs with increased expression are shown by red dots, RNAs with decreased expression are shown by blue dots; cut-offs used were a 2-fold change in expression and a q value < 0.05. The numbers of RNA with increased (Up), decreased (Down), and no change (N/C) in expression are displayed. (B) Top: Overlap analysis of all genes activated by WT and variant ZFX proteins. The numbers of genes induced by all five proteins (667) and only by WT ZFX (410) are indicated. Bottom: Overlap analysis of direct targets activated by WT and variant ZFX proteins. The numbers of direct targets common to all five proteins (271) and direct targets unique to WT ZFX (548) are indicated. (C–F) KEGG pathway analysis using the direct targets of WT and variant ZFX proteins. The top significant pathways are organized into four groups: (C) pathways more highly enriched in the set of genes regulated by the variant ZFXs than in the set of genes regulated by WT ZFX, (D) pathways only identified in sets of genes regulated by the variant ZFX proteins, (E) pathways enriched in both variant and WT gene sets, and (F) pathways enriched more in the sets of genes regulated by WT ZFX. Significance is plotted on the y axis. (G–I) Examples of differences in expression and binding patterns of direct targets for WT ZFX vs. variant ZFX proteins; left panels show the expression level of the gene (values on the y axis represent normalized read counts mapping to all gene transcripts) in cells transfected with the WT and mutant ZFX proteins, whereas right panels show the ChIP-seq signals (browser shots) of the different ZFX WT and mutant constructs at the promoter of that gene. (G) Direct targets of both WT and variant ZFX, (H) direct targets of WT ZFX only, and (I) direct targets only of variant ZFX proteins. |

Behavioral characterization of zfx knockout zebrafish (A) Representative heatmap image for novel tank assay during the first 3 min. The lines indicate the boundaries of three vertically different zones (top, middle, and bottom). (B) Quantification of average time spent in novel tank assay. Upper graph shows WT spent significantly increased time in bottom zone (t = 2.983, df = 23, p = 0.0033, n = 8); lower graph shows KO fish spent higher time in the top zone (t = 2.424, df = 23, p = 0.0118, n = 17). (C) Test apparatus for the scototaxis assay modified with gray and bright zone. The external light source is placed underneath the tank to evaluate the specific preference of adult zebrafish. (D) Representative heatmap image for scototaxis assay. (E) Quantification of percentage of average time spent in bright, gray, and dark zones. KO zebrafish spent significantly increased time in the bright zone (t = 3.516, df = 16, p = 0.0021, n = 10) compared to WT siblings (n = 8). (F) Behavioral paradigm showing the 10-min acclimatization in the round container followed by three tap stimuli with 1-min intervals. (G) Quantification of normalized velocity (cm/s) post-tap. WT (n = 11) and KO (n = 17) indicated similar response for both the first and second tap stimuli. For the third tap, KO zebrafish displayed significantly increased response (t = 2.378, df = 26, p = 0.0129). (H) Quantification of velocity change (pre- and post-tap). WT fish showed a trend of decreasing response to the tap stimuli, whereas KO fish showed significantly increased response to the third tap (t = 2.907, df = 16, p = 0.0051). PHENOTYPE:
|

ZFIN is incorporating published figure images and captions as part of an ongoing project. Figures from some publications have not yet been curated, or are not available for display because of copyright restrictions. |