
- Title
-
The probiotic SLAB51 as agent to counteract BPA toxicity on zebrafish gut microbiota -liver-brain axis
- Authors
- Giommi, C., Lombo, M., Habibi, H.R., Rossi, G., Basili, D., Mangiaterra, S., Ladisa, C., Giulia, C., Carnevali, O., Maradonna, F.
- Source
- Full text @ Sci. Total Environ.

Histological evaluation of gut samples. a,f) Intestinal Fold Height (μm), b,g) Intestinal Lamina Propria Thickness (μm), c,h) Intestinal Basal Lamina Thickness (μm), d,i) Intestinal Muscle Thickness (μm) and e,j) Number of intestinal goblet cells counted in 100 μm of fold length in female and male gut respectively, in the different experimental groups. Data are reported as mean ± standard deviation (SD) (n = 6). Letter “a” has been assigned to the highest value. Groups with the same letters do not present statistically significant differences among them, whereas groups with different letters do present statistically significant differences among them (P < 0.05). Groups labeled with two letters do not present statistically significant differences with other groups presenting either of them. Microphotographs show representative hematoxylin and eosin and alcian blue stainings in the different experimental groups. Scale bar = 50 μm. |
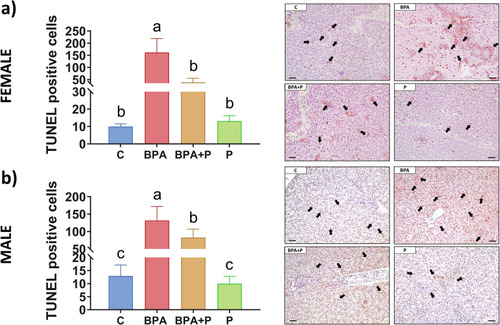
Liver TUNEL. TUNEL positive cells in a) female and b) male liver in the experimental groups. Data are reported as mean ± standard deviation (SD) (n = 3). Groups with the same letters do not present statistically significant differences among them, whereas groups with different letters do present statistically significant differences among them (P < 0.05). Letter “a” has been assigned to the highest value. Microphotographs show representative images of TUNEL assay in the female (upper) and male (lower) liver sections in which the TUNEL positive cells are indicated by black arrows. Scale bar = 200 μm. |

Brain TUNEL and IHC. a,b) TUNEL, c,d) GFAP and e,f) TAU aggregates positive cells of female and male brains respectively, in different experimental groups. Data are reported as mean ± standard deviation (SD). Groups with the same letters do not present statistically significant differences among them, whereas groups with different letters do present statistically significant differences among them (P < 0.05) (n = 6 for C and BPA in both sexes and for BPA + P and P male, n = 4 for P female and n = 8 for BPA + P female). Letter “a” has been assigned to the highest value. Microphotographs show representative images of TUNEL, GFAP and TAU in the female (left) and male (right) brain sections. Scale bar = 200 μm. |

Respiratory Burst Assay. Spleen respiratory burst assay in the different experimental groups before (white) and after stimulation with PMA [red in female (a) and blue in male (b)]. Data are reported as mean ± standard deviation (SD). Asterisks indicate statistically significant differences before and after PMA stimulation (**P < 0.01, ****P < 0.0001), whereas lower-case letters indicate statistically significant differences among the groups before stimulation and upper-case letters after the stimulation (n = 6, P < 0.05). Letter “a” and “A” has been assigned to the highest value. |
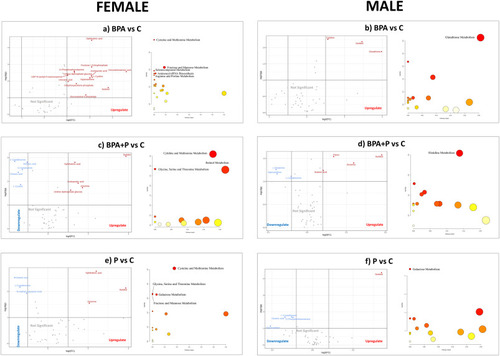
Liver metabolomic analysis. Volcano plot and pathway analysis of BPA vs C, BPA + P vs C and P vs C in a,c,e) female and b,d,f) male (n = 5 for both C and BPA + P, n = 6 for both BPA and P in female, n = 4 for all groups in male). In volcano plot, up-regulated metabolites are shown in red, down-regulated metabolites are shown in blue and not-significant metabolites are shown in grey. The X axis stands for the relevance of the metabolite within the pathway, whereas the Y for the significance of the pathway in the comparison. The color of the dots represents the level of statistical significance, red being the most statistically significant and white the least. The width of the dots indicates the relevance of the metabolites inside that pathway, the wider they are, the greater relevance they have. |
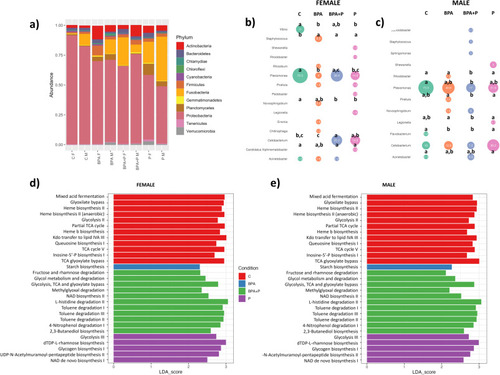
Microbiota analysis. a) Stacked bar chart representing the relative abundance of bacterial phyla in both sexes (only taxa contributing to at least 1 % of the total composition are displayed). Bubble chart showing genera abundance analysis in different groups (abundance >1 % of the total composition are displayed), determined by DESeq2 and adjusted for multiple comparisons (Benjamini-Hochberg) for b) females and c) males respectively (n = 6 for C both females and males and n = 3 for BPA, BPA + P and P for both females and males). Bubble size indicates higher (big) or lower (small) absolute abundance of bacterial genera. Letter “a” has been assigned to the highest value. Groups with the same letters do not present statistically significant differences among them, whereas groups with different letters do present statistically significant differences among them (P < 0.05). Groups labeled with two letters do not present statistically significant differences with other groups presenting either of them. LEFSa pathway prediction analysis based on gut microbial colonization data of d) females and e) males. |

|