
- Title
-
Comparative Transcriptome Analysis Reveals the Effect of Aurantiochytrium sp. on Gonadal Development in Zebrafish
- Authors
- Huang, Y., Yang, H., Li, Y., Guo, Y., Li, G., Chen, H.
- Source
- Full text @ Animals (Basel)

Changes in zebrafish gonadal index (GSI) after feeding |

Histological analysis of zebrafish fed 1% |
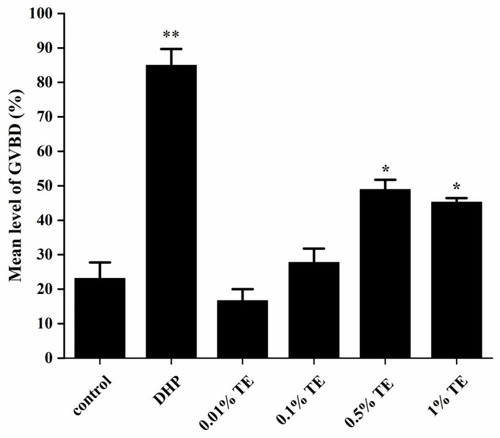
Germinal vesicle breakdown (GVBD) in zebrafish oocytes exposed to different concentrations of |
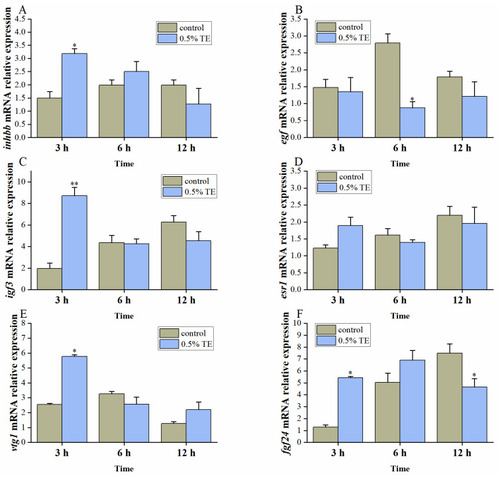
The effect of 0.5% TE on the expression of genes related to oocyte maturation in zebrafish in vivo ( |
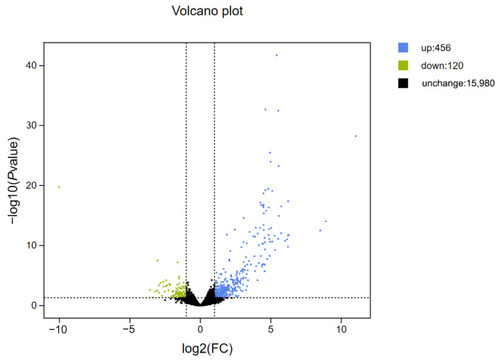
Differential expression of gonadal genes in the control group and 1% TE group. The green dots represent down-regulated differentially expressed genes, the blue dots represent up-regulated differentially expressed genes, and the black dots represent non-differentially expressed genes. The significance criteria are q < 0.05 and Fold Change ≥ 2. |
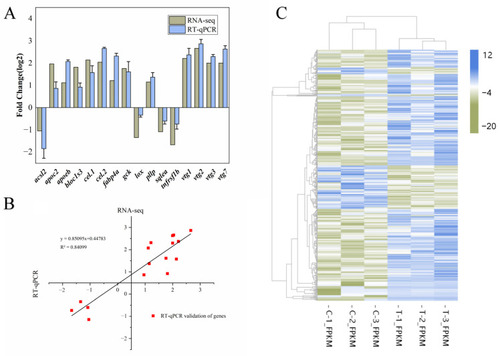
Transcriptome differential gene validation and its cluster analysis ( |
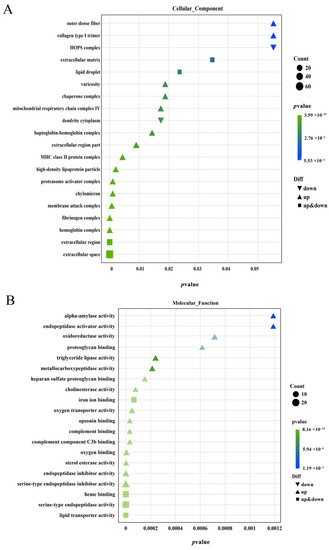
Functional classification of gonadal differentially expressed genes GO Enrichment bubble map ( |
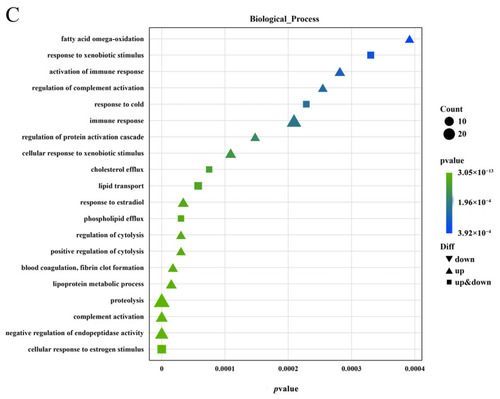
Functional classification of gonadal differentially expressed genes GO Enrichment bubble map ( |

( |