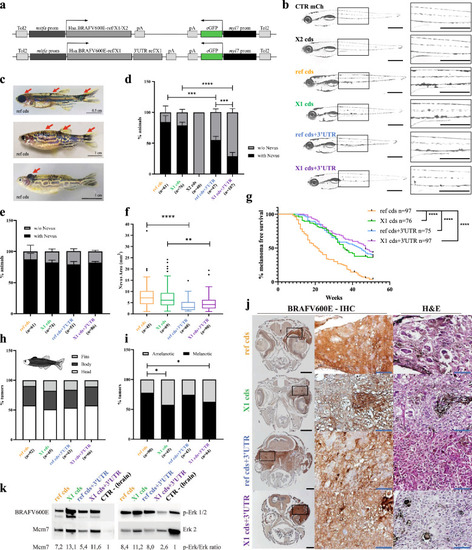
Impact of BRAFV600E isoforms on melanomagesis in zebrafish. a Schematic representation of the plasmids that express human BRAFV600E isoforms (upper, coding sequence (ref cds, X1 cds, and X2 cds); lower, ref cds + 3’UTR, and X1 cds + 3’UTR) under the control of mitfa promoter (mitfa prom), and eGFP reporter (green) under the control of cardiac myl7 promoter (myl7 prom). Tol2: minimal elements of Tol2 transposon; pA: polyA tail. b Pigmentation pattern in larvae at 5dpf. Larvae that were injected at 1-cell stage with ref and X1 cds plasmids show increased number or abnormal appearance of pigmented spots. Left: lateral view; right: lateral zoom view. A 5dpf Tg(mitfa:mCherry,myl7:eGFP);p53(lf) larva is shown as negative control (CTR mCh). Scale bars: 500 μm. c Representative examples of a juvenile fish with nevi (upper, red arrows), an adult fish with nevi (middle, red arrows), and an adult fish with a melanoma tumor (lower, red arrow). d Percentage of juvenile fish with a nevus. Nevi develop in higher percentage in juveniles injected with ref and X1 cds plasmids. Data are expressed as mean ± SEM. The number of juvenile fish per experimental condition (n) is reported in brackets. Differences were analyzed using Fisher’s exact test. e Percentage of adult fish with a nevus. Data are expressed as mean ± SEM. The number of adult fish per experimental condition (n) is reported in brackets. Differences were analyzed using Fisher’s exact test. No difference reaches statistical significance. f Size of nevi in adult fish (3 months of age). Adults injected with ref and X1 cds plasmids show nevi characterized by bigger area. Data are expressed as mean ± SEM. The number of adult fish per experimental condition (n) is reported in brackets. Differences were analyzed using Kruskal–Wallis (Dunn’s) test. g One-year long melanoma-free survival curves uncover ref cds as the most potent melanoma driver compared to X1 cds, ref cds + 3’UTR, and X1 cds + 3’UTR. The number of adult fish per experimental condition (n) is reported in brackets. Differences were analyzed using log-rank (Mantel-Cox) test. h, i Macro features of melanoma tumors developed in adults. h Tumors localization. i Presence of pigmentation. Melanotic tumors develop at higher percentage in fish injected with ref cds and ref cds + 3’UTR plasmids. The number of adult fish per experimental condition (n) is reported in brackets. Differences were analyzed using Fisher’s exact test. j Representative images of BRAFV600E immunohistochemistry staining (left) and Hematoxylin and Eosin staining (H&E, right) performed on melanoma tumors in adult fish. Black scale bar: 500 μm; blue scale bar: 90 μm. k Western blot detection of BRAFV600E (left, upper), Mcm7 (left, lower) p-Erk 1/2 (right, upper) and Erk 2 (right, lower) in representative melanoma tumors excised from adult fish. Brain tissue is used as negative control (CTR–). The quantification of Mcm7 and p-Erk/Erk ratio is reported at the bottom of the panels and is expressed as fold change over the negative control. Color coding: yellow: ref cds; green: X1 cds; black: X2 cds; blue: ref cds + 3’UTR; purple: X1 cds + 3’UTR. Statistically significant differences are indicated with asterisks: *P < 0.05, **P < 0.01, ***P < 0.001, ****P < 0.0001
|
