
- Title
-
Amino acid modified OCMC-g-Suc-β-CD nanohydrogels carrying lapatinib and ginsenoside Rg1 exhibit high anticancer activity in a zebrafish model
- Authors
- Cui, L., Liu, X., Yan, R., Chen, Q., Wang, L., Nawaz, S., Qin, D., Wang, D.
- Source
- Full text @ Front Pharmacol
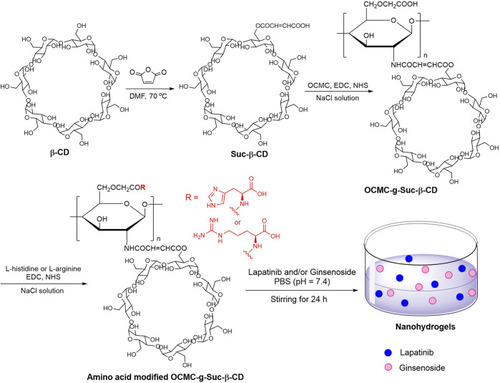
Preparation of amino acid modified OCMC-g-Suc- |

|
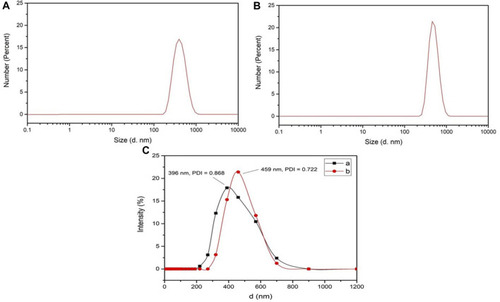
Particle size distribution of |
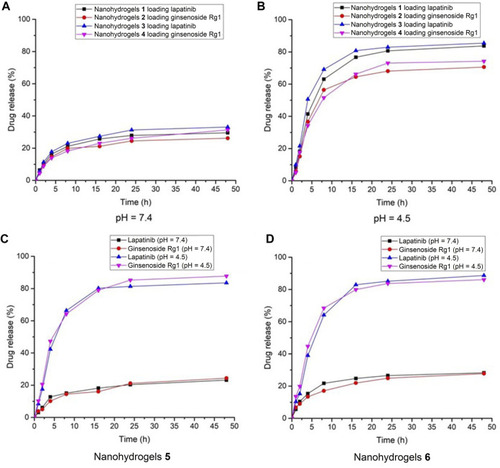
Drug release behavior of nanohydrogels |

|
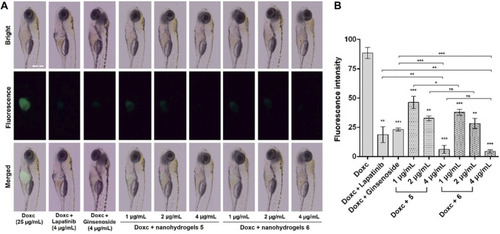
Images of zebrafish |