
- Title
-
Pleiotropic role of TRAF7 in skull-base meningiomas and congenital heart disease
- Authors
- Mishra-Gorur, K., Barak, T., Kaulen, L.D., Henegariu, O., Jin, S.C., Aguilera, S.M., Yalbir, E., Goles, G., Nishimura, S., Miyagishima, D., Djenoune, L., Altinok, S., Rai, D.K., Viviano, S., Prendergast, A., Zerillo, C., Ozcan, K., Baran, B., Sencar, L., Goc, N., Yarman, Y., Ercan-Sencicek, A.G., Bilguvar, K., Lifton, R.P., Moliterno, J., Louvi, A., Yuan, S., Deniz, E., Brueckner, M., Gunel, M.
- Source
- Full text @ Proc. Natl. Acad. Sci. USA
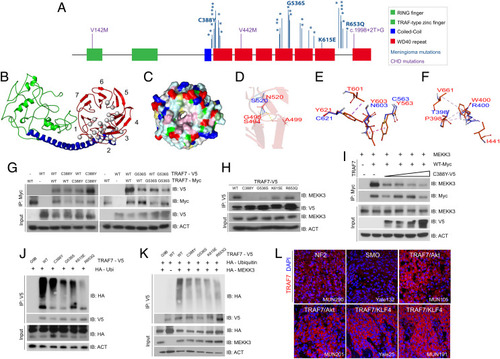
TRAF7 mutations disrupt protein structure and interactions. (A) Protein structure of TRAF7; developmental variants V142M, V442M, and c.1998+2T>G and the locations of previously reported (16) meningioma-associated mutations (asterisks; 93% map to the WD40 domains), including those analyzed in this study. (B) Predicted structure of TRAF7. The RING finger (green), coiled-coil (blue), and putative 7-WD40-repeat-containing putative ligand-binding (red) domains are indicated. The mutations (gray circles) are primarily localized to one face of the latter. (C) Representation of the WD40-domain molecular surface, exhibiting a hydrophobic patch (pink, reflecting concentration of white [small hydrophobic] and magenta [aromatic] residues) surrounding the pore of the β-propeller surface. Yellow: cysteine; pale green: proline; green: glycine; cyan: polar; blue: positively charged residues; red: negatively charged residues. (D) The N (red) to S (blue) mutation at position 520 changes hydrogen bonding (yellow dashes) between the β-strands of the preceding blade of the WD40 β-propeller domain. (E) Substitution of Y residues 563, 603, and 621 (red) with charged and polar (blue) residues results in loss of hydrophobic interaction (purple – light pink dashes). (F) The W (red) to R (blue) substitution at position 400 abrogates hydrophobic interactions with several residues involving multiple β-propeller units. (G) WT and meningioma-associated mutant forms of TRAF7 can form homo- and hetero-dimers. (H) Mutant TRAF7 disrupts the interaction with endogenous MEKK3. Coimmunoprecipitation analysis in HEK293 cells. (I) Low concentrations of mutant TRAF7 (C388Y) are sufficient to disrupt the interaction of WT TRAF7 with MEKK3. Plasmids expressing C388Y (1, 2, 3, or 4 μg) and WT (4 μg) TRAF7 were cotransfected in HEK293 cells followed by immunoprecipitation for WT-TRAF7. (J and K) TRAF7 mutants display reduced ubiquitination in the absence (J) or presence (K) of exogenous MEKK3. (L) Surgically resected TRAF7-mutant meningiomas highly express TRAF7 (genotypes of tumors shown: MUN290: NF2; Yale 132: SMO W535L; MUN105: TRAF7 R641C/AKT1 E49K; MUN201: TRAF7 L580del/AKT1 E49K; Yale 25: TRAF7 G536S/KLF4 K409Q; MUN191: TRAF7 K615E/KLF4 K409Q). (Scale bar, 50 μm.) Confocal images captured under identical settings. |
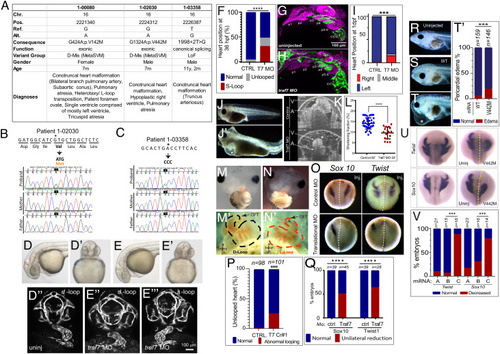
TRAF7 mutations cause congenital heart defects: reduction of TRAF7 in zebrafish (D–H) and Xenopus tropicalis (I–P) as well as overexpression of mutant TRAF7 in X. tropicalis causes developmental defects (Q–U). (A) Clinical manifestations of patients harboring inherited TRAF7 heterozygous developmental mutations. (B and C). Sanger sequencing traces of patients 1-02030 and 1-03358 and their clinically unaffected parents. The mutations are indicated in bold, and asterisk marks the mutated residue. (D–F) Injection of control (D–D’’) or splice-site (E–E’’’) TRAF7 MO in tg(kdrl:GFP;gata-1:dsRed) embryos results in pronounced heart looping defects at 36 hpf. (F). Quantification of embryos displaying cardiac looping defect ****: P < 0.0001 (Fisher’s exact test; n= # of embryos). (G and H). Traf7 morphants exhibit reduced sox10 expression, disorganized pharyngeal arches. (H) Uninjected zebrafish (Tg:kdr:GFP, sox10:mRFP) embryo at 30 hpf showing pharyngeal arches 1 to 6 (p1 to p6). The otic placode (op) and common cardinal vein (CCV) are also labeled. (I) TRAF7 morphant at the same stage. Note the reduced size of the pharyngeal arches, disorganization of p3 to p6, and reduced Sox10 expression. Green channel: endothelial cells; magenta: Sox10-expressing cells. (I) Distribution of heart position in control and TRAF7 1-d postfertilization morphants. Control: Left = 97.29% ± 3.29; middle= 0.83% ± 1.67; right= 1.88 ± 2.19, from 112 embryos total. TRAF7: Left = 76.31% ± 9.32; Middle = 3.07% ± 5.10; Right = 20.62 ± 9.99, from 112 embryos total. Two-way ANOVA with Bonferroni’s multiple-comparison test, P = 0.0004 for left heart position. J−K. Injection of control (J) or splice-site (J’) TRAF7 MO in one-cell stage Xenopus embryos results in extensive pericardial edema (asterisk). Optical coherence tomography (OCT) highlights the edema (asterisk) and malformed heart (K), reflected in a significant reduction of the shortening fraction (L) at 3 dpf (stage 46) (Movie S3). Mann–Whitney test (scatter plot mean ± SD; n = 17, TRAF7 splice-site MO injected; n = 41, control MO injected.) M–N’ TRAF7 CRISPR (CR#1) injection in one-cell stage Xenopus embryos results in pronounced heart looping defects at 48 hpf (N, N’) as compared to controls (M, M’) (Movie S4). OFT: outflow tract, V: ventricle. O. In situ hybridization analysis of Xenopus embryos (stage 16 to 18, 15 hpf): Unilateral injection (Inj.) with splice-site TRAF7, MO at two-cell stage shows disrupted expression of neural crest markers Sox10 and Twist on the injected side when compared to the internal uninjected control. (P) Quantification of embryos displaying cardiac looping ****: P < 0.0001 (Fisher’s exact test; n= # of embryos). (Q) Quantification of control or TRAF7 splice-site MO-injected embryos analyzed for Sox10 and Twist expression. n = number of embryos. ****: P < 0.0001 (Fisher’s exact test; n = # of embryos). (R–T’) Severe pericardial edema in Xenopus embryos following injection of TRAF7 mRNA encoding mutant form V442M (T) but not WT (S) as compared to uninjected embryos (R). Quantification of embryos displaying pericardial edema (T’), ***: P < 0.001 (Fisher's exact test, n = # of embryos). (U) In situ hybridization analysis of Xenopus embryos (stage 17, 18 hpf): Decreased expression of the neural crest markers Twist and Sox10 following unilateral injection of TRAF7 V442M mRNA at the 2-cell-stage. (V). Quantification of control or TRAF7 splice-site MO-injected embryos analyzed for Sox10 and Twist expression. A = Control, B = WT TRAF7, C = V442M TRAF7. ***:P < 0.001: Pairwise Fisher’s exact test with FDR correction, n = # of embryos. |

Reduction of TRAF7 causes ciliopathy phenotypes in zebrafish (A–G) and Xenopus tropicalis (H–R), and single-cell transcriptomic analysis reveals TRAF7 association with cilia-related genes (S–V). (A and B) Pronephric cysts and axial curvature in 2.5 dpf Traf7 morphant zebrafish larva (A) but not control (B). Embryos exhibit substantial ventrally directed curling and cysts that appear as small spherical clearings in the pronephros (arrowhead). (C and D) Hydrocephalus in 2 dpf embryos following injection of TRAF7 splice-site (R), but not control (Q), MO at the 1-cell stage. Quantification of embryos presenting with hydrocephalus (S) ****: P < 0.0001 (two-sided Fisher’s exact test, n= # of embryos). (E) Quantification of curled-down phenotype. This occurs in ~75% of MO-injected embryos, but never in controls. ****: P < 0.0001 (two-sided Fisher’s exact test, n= # of embryos). (F) Quantification of cystic phenotype. This appears in ~33% of MO-injected embryos, but never in controls. ****: P < 0.0001 (two-sided Fisher’s exact test, n= # of embryos). (G) Quantification of hydrocephalus phenotype. This appears ~75% of the time in injected fish, but never in uninjected controls. ****: P < 0.0001 (two-sided Fisher’s exact test, n= # of embryos). (H–N) Hydrocephalus and cranial (arrowheads) and tail (arrows) defects in 2 dpf (stage 38-39) in X. tropicalis embryos injected with translational (I) but not control (H) MO, or with CRISPR/Cas9 targeting TRAF7 (K), but not Cas9 alone (J). Scale bar: 200 μm. (L) Quantification of curled tail phenotype. This appears in ~47% of MO-injected embryos, but never in controls. ****: P < 0.0001 (two-sided Fisher’s exact test, n = # of embryos); (M) Quantification of hydrocephalus/cranial defect phenotype. This appears in embryos injected with translational morpholino (~30%) and splice-site morpholino (~25%), but never in embryos injected with control morpholino. CRISPR2 injections are more effective (~25%) than CRISPR 1 (~12%) as compared to CAS9 in eliciting cranial defect phenotype. ****: P < 0.0001 (two-sided Fisher’s exact test, n= # of embryos); (N) Rescue of cranial defects upon coinjection of 100 pg of WT-TRAF7 mRNA and splice-site TRAF7-MO. n = number of embryos. ***: P < 0.001 (two-sided Fisher’s exact test, n = # of embryos). (O–R) Traf7 morphant (P) but not control (O) X. tropicalis embryos exhibit enlarged kidneys at 5 dpf as visualized by OCT; (Q) Quantification of kidney size: TRAF7 morphant embryos show a variable but overall significant increase in kidney size as compared to control embryos (Movie S5). ****: P < 0.0001 (two-sided Fisher’s exact test, n= # of embryos); (R) Transmission electron microscopic analysis of the developing pronephros at 5 dpf shows large vesicular bodies suggestive of precystic kidneys. (S–X) scRNAseq analysis of E14.5 mouse meninges obtained from publicly available data (25). Dot plot showing mean expression for marker genes for the arachnoid, dura, pia, and proliferating cell clusters. The size and color density of the dots represent fraction of cells expressing the gene in the groups and mean expression, respectively. Shaded rectangles indicate genes enriched in cell clusters. * Indicating the relative expression of Traf7 within cell clusters (S). PHATE plot showing different cell clusters in scRNAseq data in (S). Colors representing cell clusters [see panel V] (T). PHATE plot demonstrating Traf7 expression profile in mouse meningeal cell clusters (U). Jitter plot showing enrichment of Traf7 in proliferating meningeal cluster, more prominently in Proliferating-2 subcluster (V). Gene set enrichment analysis (GSEA) indicating the enrichment of cilia-related genes (obtained from CiliaCarta Database) within the genes that show positive (Left) or negative (Right) association with Traf7 expression in knn-DREMI analysis. Positively associated genes demonstrating significant enrichment for cilia-related genes, while negatively associated genes do not. NES: Normalized enrichment score (W). Representative DREVI plots for the cilia-related genes showing strong positive relationship with Traf7 expression in knn-DREMI analysis (X). PHENOTYPE:
|
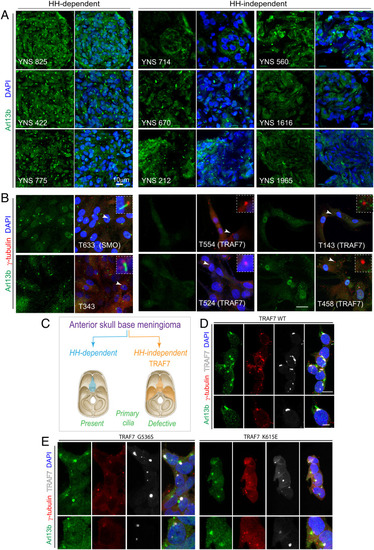
Loss of primary cilia in TRAF7-driven meningiomas. (A) Meningiomas that are either HH-dependent or -independent [based on microarray analysis, (31)] stained for Arl13b (primary cilia) and DNA (DAPI). Confocal immunofluorescence microscopy reveals that HH-dependent tumors express primary cilia, while HH-independent (TRAF7 mutated) tumors display reduced, abrogated, or absence of primary cilia. Genotypes of tumors used YNS 825: SMO L412F; YNS 422 and YNS 775: HH-driven based on gene expression analysis, mutation unknown; YNS 714: TRAF7 unknown mutation/KLF4 K409Q; YNS 670: TRAF7 K498E/KLF4 K409Q; YNS 212: TRAF7 splice-site mutation: c.1135+5G>A/ AKT E17K; YNS 560: AKT1-E17K (± TRAF7); YNS 1616: TRAF7 I368N/KLF4 K409Q; YNS 1965: TRAF7: R653Q/AKT1-E17K. 3D projections of equivalent z-stacks are shown. (Scale bar, 10 μm.) (B) Primary cultures of meningiomas that are either HH-dependent or -independent [based on microarray analysis, (31)] stained for Arl13b (primary cilia) and γ-tubulin (centrosomes, marking base of cilia). Arrowheads indicate region shown at higher magnification in inset. All images captured under identical confocal settings. [Genotypes of cultures used T633 (derived from YNS 825): SMO L412F; T343 (derived from YNS 422) and T596 (derived from YNS 775): HH driven based on gene expression analysis, mutation unknown; T554 (derived from YNS 714): TRAF7 unknown mutation/KLF4 K409Q; T524 (derived from YNS 670): TRAF7 K498E/KLF4 K409Q; T143 (derived from YNS 212): TRAF7 splice-site mutation: c.1135+5G>A/ AKT E17K); T458 (derived from YNS 560): AKT1-E17K (±TRAF7). (Scale bar: 20 μm.) (C) Schematic representation of anatomic localization of HH-dependent (turquoise) and -independent (orange) meningiomas, driver mutations, and primary cilium status. (D–E) Overexpression of V5-tagged WT and mutant (G536S or K615E) TRAF7 in HEK293 cells followed by staining for Arl13b (green), γ-tubulin (red), and V5 (white, marking TRAF7). Only mutant forms of TRAF7 affect the primary cilium. (Scale bar: 20 μm.) |
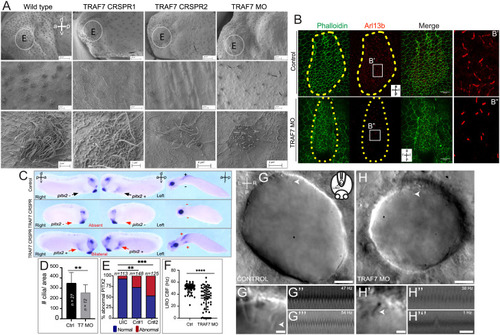
TRAF7 knockdown in Xenopus tropicalis (A–G) and zebrafish (H–J’’’) affects mono- and multi-cilia in the left–right organizer (LRO). (A) Scanning electron microscopic images of Xenopus epidermis reveal defective cilia formation on TRAF7 depletion with either CRISPR #1, #2, or MO. Circled areas are magnified in the bottom panels. (Scale bars: Top row: 100 µm, middle row: 10 µm, bottom row: 3 µm.) (B) Xenopus embryos were injected at 1-cell stage and dorsal explants were prepared at stage 17 to visualize the left–right organizer (LRO). Specimens were processed for immunohistochemistry (IHC) to assess ciliation rate and cell surface area. Compared to uninjected controls, TRAF7 morphants have fewer cilia, as shown by acetylated tubulin (red) and phalloidin (actin, to outline cell boundaries; green). a = anterior, l = left, p = posterior, r = right. C. Analysis of pitx2c expression in stage 28 to 30 Xenopus embryos. Embryos are viewed laterally from the right (first column), the left (second column), and ventrally (third column). Expression of pitx2c is normally in the left lateral plate mesoderm (LPM, black arrow). CRISPR-mediated TRAF7 knockdown results in abnormal absent pitx2c expression with no pitx2c mRNA found in the left or right LPM (Middle panel, red arrows); or abnormal bilateral pitx2c expression with pitx2c mRNA found in both left and right LPM (Bottom panel, red arrows). (D) Bar plot demonstrating quantification of ciliation in relation to cell surface area in the LRO of TRAF7 morphant and control X. tropicalis embryos in (C). **: P < 0.00: t test with Welch correction, n= # of embryos. E. Quantification of pitx2c expression in uninjected controls (UICs) and traf7-G0 mutants by sgRNA#1 and #2. Abnormal includes absent and bilateral pitx2c expression. Statistical calculations were performed using a Chi-square test comparing the number of affected embryos against the number of wild-type embryos. **P < 0.01, ***P < 0.001; n, number of analyzed tadpoles. (F–H). TRAF7 is required for proper motility of cilia in zebrafish LRO. (F) Quantification of the ciliary beating frequency (CBF) in control (60 cilia from eight embryos) and TRAF7 morphants (58 cilia from eight embryos). Mean control CBF= 50.5 Hz ± 7.14. Mean TRAF7 CBF = 33.47 ± 19.15. Two-sample t tests, P = 6.5 × 10⁻⁹; mean ± SD. Representative images of the LRO cilia of a control MO-injected embryo (eight somite stage) (G and G’) and of a TRAF7 MO-injected embryo (six somite stage) (H and H’) (Movies S7 and S8). (Scale bars: G, H = 10 µm; G’, H’ = 2 µm.) White arrows indicate cilia. G’ and H’ are close-ups of the imaged regions in the anterior side of the LRO in G and H (Movies S9–S12). Representative kymographs of two individual “control” cilia (G” and G’’’) and of TRAF7 knockdown cilia (H’’ and H’’’). Kymograph total duration 500 ms. (Scale bar, 100 ms.) PHENOTYPE:
|
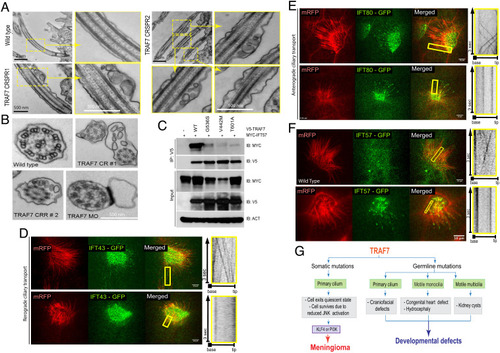
TRAF7 interacts with IFT57, and its knockdown in X. tropicalis impairs intraflagellar transport. (A and B). TEM micrographs of cilia from the pronephros of WT- and TRAF7-morphant Xenopus embryos at 5 dpf. Low- and high (yellow boxes)-magnification views of flat-embedded sections of longitudinally sectioned cilia show frequent blebbing only in TRAF7 morphant samples. Cross-sections of cilia from WT and morphant embryos show the “9 + 2” microtubule doublet configuration with the presence of dynein arms. Sections of cilia in TRAF7 morphant embryos show frequent blebs containing electron-dense material. (C and D). In vivo imaging of IFT dynamics in Xenopus multiciliated cells. Still frames from a video of IFT43-GFP (C) and IFT80-GFP (D) to track intraflagellar transport in a multiciliated cell (Movies S14–16). Cilia are colabeled with mRFP. The yellow box indicates the cilia shown in the right kymograph, depicting still frames from a time-lapse video showing movement of a single control cilium. Time is indicated in seconds. (Scale bars, 10 µm.) (E) Meningioma and CHD- and craniofacial defect-associated TRAF7 mutants (G536S, V442M, and T601A, respectively) show reduced interaction with IFT57. Coimmunoprecipitation analysis in HEK293 cells. (F) In vivo imaging of IFT dynamics in Xenopus multiciliated cells. Still frames from a video of IFT57-GFP to track intraflagellar transport in a multiciliated cell (Movies S17 and S18). Cilia are colabeled with mRFP. The yellow box indicates the cilia shown in the right kymograph, depicting still frames from a time-lapse video showing movement of a single control cilium. Time is indicated in seconds. (Scale bars, 10 µm.) (G) TRAF7 mutations disrupt ciliogenesis resulting in developmental (congenital heart and craniofacial) defects and disease (anterior skull-base meningioma). |