
- Title
-
Endothelial Brg1 fine-tunes Notch signaling during zebrafish heart regeneration
- Authors
- Xiao, C., Hou, J., Wang, F., Song, Y., Zheng, J., Luo, L., Wang, J., Ding, W., Zhu, X., Xiong, J.W.
- Source
- Full text @ NPJ Regen Med

a, b Immunofluorescence staining of Brg1 and EGFP on paraffin sections of Tg(fli1:nucEGFP) transgenic hearts from sham-operated (a) and injured zebrafish hearts (b) at 7 dpa (arrowheads, Brg1- and EGFP-positive endothelial cell nuclei). c, d RNAscope in situ hybridization of brg1 and kdrl probes in frozen sections from sham-operated (c) and injured hearts (d) at 3 dpa (arrows, brg1- and kdrl-positive endothelial cells). The upper right corner presented in (a–d) is a high-magnification image of the framed area. e–h Representative images of Acid fuchsin orange G (AFOG) staining (e, f) and immunofluorescence with anti-myosin heavy chain (MF20) (g, h) of heart sections from control siblings Tg(ubi:LoxP-DsRed-STOP-LoxP-dn-xbrg1) (Ctrl) and endothelium-specific dominant-negative |

a Heatmap displaying Z-score normalized gene expression for differentially expressed genes between FACS-sorted kdrl:EGFP endothelial cells from dominant-negative Brg1 groups (DNK1 and DNK2) and control groups (CtrlK1 and CtrlK2). FPKM value of each gene was normalized using Z-scores across samples. Columns represent individual samples (two biological replicates for each group); rows represent differentially expressed genes ordered by hierarchical clustering. Labeled genes are part of the differentially expressed Notch signaling genes. The upregulated genes in the DNK group that were labeled with ‘red color’ had H3K4me3 peaks in their promoters. b Venn plot representing the intersection of H3K4me3 peaks between Ctrl and DN groups. c Heatmaps and summary plots displaying the signal profile of normalized read coverage around three categories of H3K4me3 peaks across different samples. The read coverage was normalized to 1x sequencing depth in all samples. Each row of the heatmap represents one peak, with coverage plotted across the 3 kb surrounding the peak summit. H3K4me3 peaks were classified into three categories: Ctrl-Specific Peaks represent peaks specifically in the Ctrl group; Overlapped Peaks represent peaks overlapped between the Ctrl and DN groups; DN-Specific Peaks represent peaks specifically in the DN group. The genomic distribution for three types of peaks is presented with pie charts on the right side. d Venn plot representing the intersection between genes with promoters marked by Overlapped Peaks and DN-Specific Peaks and genes that were differentially upregulated in the DNK group. |
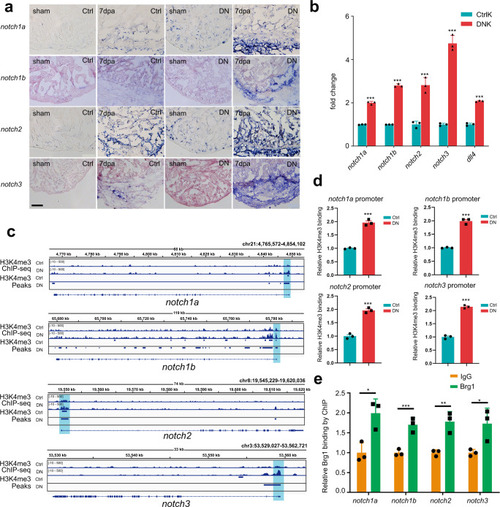
a Representative images of RNA in situ hybridization with notch1a, notch1b, notch2, and notch3 probes on frozen sections of sham-operated Ctrl hearts, injured Ctrl hearts, sham-operated DN hearts, and injured DN hearts at 7 dpa. Scale bar, 100 μm. b Quantitative RT-PCR analysis showing that the expression of notch receptors and ligand in FACS-sorted kdrl:EGFP endothelial cells from the DNK group was higher than those from the CtrlK group. Data represented one of three independent experiments. Data were mean fold changes ± s.e.m., ***p < 0.005, unpaired t-test. c H3K4me3 ChIP-seq showing the traces and peak intervals of representative genomic loci from Ctrl and DN hearts. H3K4me3 peaks in both Ctrl and DN groups were shown as bars. Putative promoter regions were indicated in blue color. d Anti-H3K4me3 ChIP and quantitative PCR in Ctrl and DN hearts at 7 dpa (primers designed from notch receptor genomic regions: notch1a, −171/+3 bp; notch1b, −41/+58 bp; notch2, −263/−115 bp; notch3, +394/+504 bp; ATG site designed as +1 bp). Data represented one of three independent experiments. Data were the mean fold changes ± s.e.m.; ***p < 0.005, unpaired t-test. e Anti-Brg1 ChIP and quantitative PCR in wild-type hearts at 3 dpa. Data represented one of two independent experiments. Data were the mean fold change ± s.e.m.; *p < 0.05, **p < 0.01, ***p < 0.005; unpaired t-test. n number shown here (b, d, e) indicated technical replicates. |

a, b Immunostaining showing that Mef2C+ and PCNA+ proliferating cardiomyocytes of control (a) and endothelial NICD-overexpressing heart sections (b) at 7 dpa after 4-HT induction. c Statistics of panels (a) and (b) (data are the mean fold change ± s.e.m.; **p < 0.01, unpaired t-test). d–i Representative images of immunostaining showing that, compared with control siRNA treatment (d), PCNA+/Mef2C+ proliferating cardiomyocytes decreased at 7 dpa in DN-xBrg1 hearts (DN) treated with control siRNA (e), which were partially rescued by either notch1a (f), notch1b (g), notch2 (h), or notch3 (i) siRNA treatment in the presence of 4-HT. Scale bar, 100 μm. j Statistics of panels (d–i) (data are the mean ± s.e.m.; *p < 0.05; **p < 0.01; ***p < 0.005; one-way analysis of variance [F = 32.5] followed by Dunnett’s multiple comparison test). k–n Representative images of immunostaining at 7 dpa showing that, compared with DMSO treatment (k), PCNA+/Mef2C+ proliferating cardiomyocytes in DN mutant hearts decreased (l), which were partially rescued by either DAPT (m) or MK-0752 treatment (n) in the presence of 4-HT. Scale bar, 100 μm. o Statistics of panels (k–n) (data were the mean ± s.e.m.; ***p < 0.005; one-way analysis of variance [F = 22.4] followed by Dunnett’s multiple comparison test). n number shown here (c, j, o) indicated biological replicates. |

a Quantitative RT-PCR of kdm genes expression, normalized by gapdh. b–d Representative images of RNAscope in situ hybridization with kdrl and kdm7aa probes (scale bar, 100 μm) and high-magnification image of boxed region in (c) (arrowheads, double kdrl- and kdm7aa-positive endothelial cells). e Immunoprecipitation (IP) assays with either anti-Myc or anti-Brg1 antibody in 293T cells. Inputs were used as loading controls and IgG as negative controls. The blots were derived from the same experiment, and they were processed in parallel. f Quantitative RT-PCR analysis showing that the expression levels of notch1a, notch1b, notch2, and notch3 from hearts at 7 dpa injected with encapsulated kdm7aa siRNA was higher compared with the control siRNA group. Data represented one of three independent experiments. Data were mean fold changes ± s.e.m., ***p < 0.005, unpaired t-test. g Luciferase reporter assays in 293T cells stably expressing the notch promoter-luciferase reporter in the pGL4.26 vector. Expression plasmid clones containing kdm7aa, brg1, or dn-xbrg1 were co-transfected into cells stably expressing each notch reporter. Data represented one of two independent experiments, ***p < 0.005, one-way analysis of variance (F = 110.6 for the left panel and 60.3 for the right panel) followed by the Bonferroni test. n number shown here (f and g) indicated technical replicates. h–j Representative images of immunostaining showing the numbers of Mef2C+/PCNA+ proliferating cardiomyocytes (arrowheads, Mef2C+/PCNA+ proliferating cardiomyocytes; scale bar, 100 μm). k Statistics of panels (h–k) (n numbers indicated biological replicates; data were the mean ± s.e.m.; ***p < 0.005; one-way analysis of variance [F = 36.79] followed by Dunnett’s multiple comparison test). |