
- Title
-
Biomechanical induction of mild brain trauma in larval zebrafish: effects on visual startle reflex habituation
- Authors
- Beppi, C., Penner, M., Straumann, D., Bögli, S.Y.
- Source
- Full text @ Brain Commun
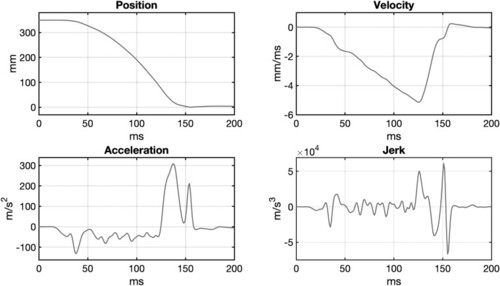
Concussion procedure. Features of the motion curve [position, velocity, acceleration and jerk] fed into the Linmot software and performed by the motor: duration = ∼121 ms; length = 320 mm; peak velocity = ∼5.1 m/s2; peak (initial) acceleration = ∼132 m/s2; peak (final) deceleration: 308.05 m/s2 (∼31.41*g), peak jerk = ∼66 785.5 m/s2. |
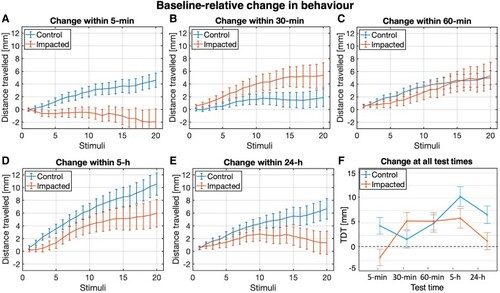
Change in startle responses over test times. In A, B, C, D and E, change in distance travelled (±1 SE) of each group relative to their respective baseline levels, at each stimulus, for each re-test time. In F, change in TDT (±1 SE) of each group relative to their respective baseline levels, at each re-test time (2: 5 min, 3: 30 min, 4: 60 min, 5: 5 h, and 6: 24 h). A 2 × 5 mixed-design ANOVA was performed to test if the baseline-relative change in TDT at all re-test times (5 min, 30 min, 60 min, 5 h and 24 h) would differ between the control group (n = 70) and the impacted (n = 72). As the data did not fulfil the parametric test assumptions of sphericity and homoscedasticity, corrected F statistics (Greenhouse–Geisser, Welch’s or Brown–Forsythe) were considered to determine statistical significance. No significant main effect of group was found (P > 0.05). The main effect of time was instead significant [F(3.707,518.937) = 7.114, P < 0.001]. However, the significant interaction between group and test time [F(3.707,518.937) = 5.158., P < 0.001] indicated that the effect of time was different for the control and impacted group. Two one-way repeated-measures ANOVAs were run to break down the interaction effect, analysing the effect of time (five levels) for the control and impacted groups separately. A significant effect of time [F(4,276) = 8.171, P < 0.001] was found on the baseline-relative change in TDT of the control group. Pairwise comparisons further indicated that the increase in TDT relative to baseline was significantly larger at Test Time 5 (5-h P-I, M = 10.28, SE = 1.78) than at Test Time 2 (5-min P-I, M = 4.44, SE = 1.15, P = 0.005), Test Time 3 (30-min P-I, M = 1.71, SE = 1.43, P < 0.001) and Test Time 4 (60-min P-I, M = 4.91, SE = 1.14, P = 0.037). The baseline-relative increase in TDT at Test Time 6 (24-h P-I, M = 6.64, SE = 1.65) was also significantly larger than at Test Time 3 (P = 0.03). The results of the ANOVA for the impact group also revealed a significant effect of time [F(3.296,234.048) = 5.134, P = 0.001] over the baseline-relative change in TDT. Pairwise comparisons further indicated a significantly larger (baseline-relative) increase in TDT at Test Time 4 (M = 5.34, SE = 2.14, P = 0.033) and Test Time 5 (M = 5.95, SE = 2.16, P = 0.032), compared to Test Time 2 (M = −1.95, SE = 2.03), when the TDT instead decreased relative to baseline. No further statistical differences at pairwise levels were found. |

Population-level habituation descriptives. Descriptive statistics of the mean (±1 SE) amplitude (A, D, G, J), decay constant (B, E, H, K) and offset (C, F, I, L) of 500 bootstraps of locomotor distance travelled over the 20 visual stimuli—fitted to a single exponential—for the control and impacted groups, at baseline, 5-min, 30-min, 60-min and 24-h P-I. |