
- Title
-
Beneficial Effect of Vitamin D on Non-Alcoholic Fatty Liver Disease (NAFLD) Progression in the Zebrafish Model
- Authors
- Grinberg, L., Dabbah Assadi, F., Baum, G., Zemel, R., Tur-Kaspa, R., Shochat, C., Karasik, D., Karpuj, M.V.
- Source
- Full text @ Nutrients

Diet and VitD supplementation effect on NAFLD in zebrafish: timeline of experiment. Establishing NAFLD in zebrafish was achieved by feeding 3 meals a day for 2 months while control group were fed twice a day. Afterwards, fish were divided into 6 study groups and treatment was applied for 3 months. |
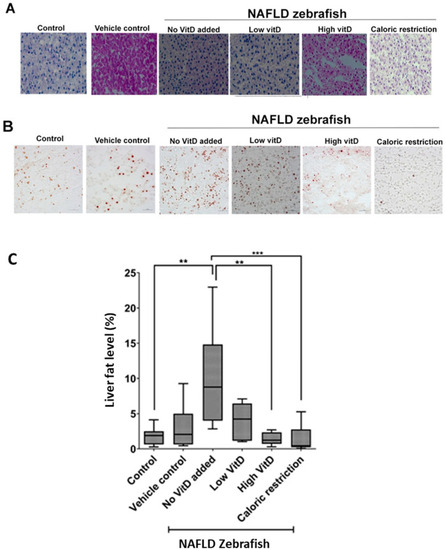
Liver morphology and fat level in NAFLD zebrafish supplemented with VitD. Histology staining of liver sections was performed in the following groups: control (normal feeding; 2 meal/day/3L tank), vehicle control (2 meal/day/3L tank with ethanol addition), no VitD added (3 meal/day/3L tank), low VitD (3 meal/day/3L tank with 0.049 µg VitD per meal), high VitD (3 meal/day/3L tank with 1.25 µg VitD per meal), caloric restriction (1 meal/day/3L tank). (A) Liver morphology by hematoxylin and eosin staining. (B) Representative images of lipid content in the liver measured by ORO staining. Magnification ×40, scale bar 20 µm. (C) For each group, images of ORO-stained area were used to calculate the fat level in the liver. ** p < 0.05, *** p< 0.001. |
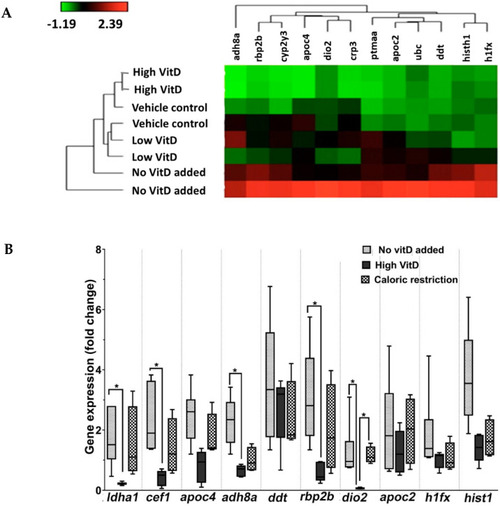
RNA sequencing and validation of the top genes by RT-qPCR in NAFLD zebrafish supplemented with VitD. (A) Heat map of top differentially expressed protein-coding genes. The expression of 12 genes was downregulated significantly in high VitD-supplemented as compared to NAFLD group (FDR-adjusted p < 0.05). (B) Gene expression by RT-qPCR in NAFLD, NAFLD plus high VitD, and caloric restriction groups. * p < 0.05. |
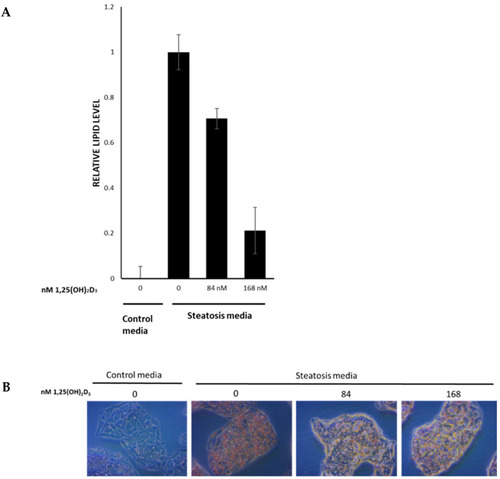
The effect of 1,25(OH)2D3 on lipid accumulation in HepG2 cells. (A) Oil Red O staining of HepG2 cells treated with steatosis medium with different concentrations of 1,25(OH)2D3. (B) Relative measurement of Oil Red O levels extracted from HepG2 cells treated with steatosis medium with different concentrations of 1,25(OH)2D3. Error bars represent standard error of the mean. n = 3 for VitD treatments and n = 4 for controls. |