
- Title
-
A low-cost smartphone fluorescence microscope for research, life science education, and STEM outreach
- Authors
- Schaefer, M.A., Nelson, H.N., Butrum, J.L., Gronseth, J.R., Hines, J.H.
- Source
- Full text @ Sci. Rep.
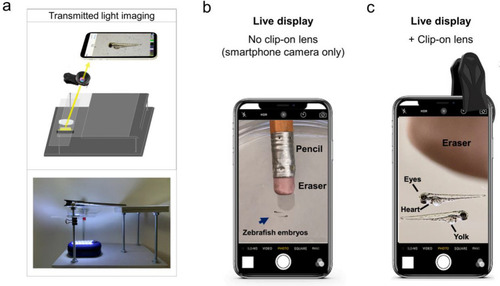
Live view of non-fluorescent specimens using the glowscope frame. (a) Illustration shows the light path for transmitted light viewing. Components shown include the smartphone, clip-on lens (black), glowscope frame (gray), stage and viewing platform (transparent), petri dish containing a specimen, and a LED work lamp positioned under the stage and viewing platform. (b) Image view using a smartphone camera without the clip-on lens shows zebrafish embryos (blue arrow, 3 dpf). A standard pencil (eraser side) is shown as a size reference. (c) Image view using the additional clip-on lens shows the same zebrafish embryos and pencil eraser seen in panel (b). Images shown in panels (b–c) are native magnification (not stretched) as seen on live-view, acquired using an Apple iPhone 12 Pro with 1x (middle magnification) lens, 6 × digital zoom. |

Use of recreational LED flashlights and theater stage lighting filters for smartphone green fluorescence microscopy. (a) Schematic of components used for green fluorescence viewing on the glowscope. (b–d) Representative fluorescence images of transgenic zebrafish embryos (3–4 dpf, lateral views) expressing green fluorescence in cell-type specific patterns. Reporter lines viewed include Tg(nkx2.2a:memGFP) (b), Tg(myl7:EGFP) (c), and Tg(phox2b:EGFP) (d). (e) Image shows the glowscope in use for green fluorescence viewing. (f–g) Plots show the blue LED flashlight emission wavelength (black and blue lines, measured using a Vernier spectrometer) in comparison to the excitation profile of EGFP (gray, obtained from www.fpbase.org). The dashed box region in panel (f) is further magnified in panel g to show the effect of the R4990 filter with greater detail. Images in panels (b–d) were acquired using an Apple iPhone XR. |
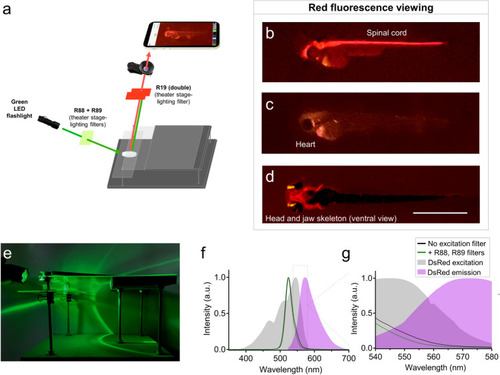
Glowscope detection of red fluorescent proteins. (a) Schematic of components used for red fluorescence viewing on the glowscope. In comparison to green fluorescence viewing, flashlight and filters are changed, but the remainder of the glowscope is unchanged. (b–d) Representative fluorescence images of transgenic zebrafish embryos (3–4 dpf, lateral views) expressing red fluorescence in cell-type specific patterns. Reporter lines viewed include Tg(olig2:DsRed) (b), Tg(myl7:mCherry) (c), and Tg(sox10:mRFP) (d). Scale bar is 1 mm. (e) Image shows the glowscope in use for red fluorescence viewing. (f–g) Plots show the green LED flashlight emission wavelength (black and green lines, measured using a Vernier spectrometer) in comparison to the excitation profile of DsRed (gray, obtained from www.fpbase.org). The dashed box region in panel (f) is further magnified in panel (g) to show the effect of the R88 + R89 filters with greater detail. Images in panels (b–c) were acquired using an Apple iPhone XR and panel (d) was acquired using an iPhone 12 Pro. |

Summary of glowscope components and smartphone compatibility. (a) Table shows the basic components and costs (at the time of this study) in US Dollars. (b) Representative images of Tg(phox2b:EGFP) zebrafish embryos demonstrate compatibility with all devices tested, but subtle differences between various tablets and smartphones used for testing. Scale bar is 1 mm. |
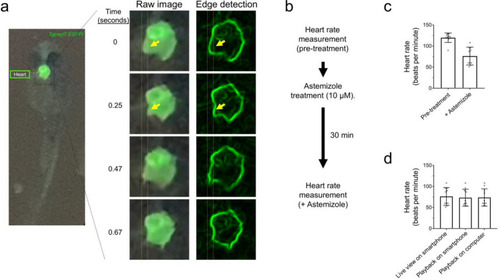
Glowscope detection of drug-induced changes to heart rate in transgenic zebrafish embryos. (a) Left fluorescence image shows GFP expression in the heart of a Tg(myl7:EGFP) embryo (ventral view). The boxed region is further magnified in the middle column, which from top to bottom show chamber movements across a video acquired on an iPhone 11 Pro smartphone. To aid viewing of chamber movements, these videos were transferred to a laptop, opened in ImageJ (free software), and processed using edge detection, which outlines the walls of the chambers. Static arrows highlight heart chamber movements. (b) Flow chart of the pre- and post-imaging of zebrafish heart rate in response to astemizole treatment (10 µM). (c) Plots show the average heart rate of zebrafish embryos prior to and after treatment with astemizole. n = 10 animals measured in one independent experiment, P = 0.0002, paired two-tailed t-test. (d) Summary of measurements conducted while recording the video in real time (left bar), viewed on the smartphone after recording the video (middle bar), or viewed on a laptop (right bar). N = 10 animals measured in one independent experiment, P = 0.942, one-way ANOVA. For panels (c–d), scatter plot points represent individual zebrafish (heart) rate measurements and error bars represent standard deviation. |

Glowscope detection of drug-induced cardiac arrythmia. (a–b) Still images from a glowscope video (acquired on an iPhone 11 Pro) show atrium and ventricle chambers in a 3 dpf Tg(myl7:EGFP) zebrafish embryo. Images show either the raw (unedited) view of heart fluorescence directly from smartphone video recording (a) or a processed view of the same heart after edge detection was performed on a computer using Fiji (b). Blue and magenta rectangles show the regions of ventricle and atrium chambers used for high-magnification viewing and analysis in (c–d). (c) Images show a timecourse (top to bottom) of ventricle (left) or atrium (right) chamber movements detected by the glowscope (corresponding to boxed regions in panel b). The small, dash-boxed regions of interest were used to monitor fluorescence intensity changes over time. Asterisks highlight frames where the heart chamber wall has moved into the region of interest with respect to the prior frame. (d) Graphs of fluorescence intensity vs. time plotted for atrium and ventricle chamber reveals oscillating chamber movements. Measurements within the same embryo (N = 1) were separately acquired and analyzed before (upper) and after astemizole treatment (lower). The maximum fluorescence intensity (in arbitrary units) within the dash-boxed region of interest shown in panel (c) was obtained and plotted for each time frame of the video recording, resulting in a fluorescence peak each time the chamber fluorescence entered and occupied the boxed region of interest. Note the differences in both heart rate between control and astemizole-treated hearts as well as the arrhythmic 2:1 atrial:ventricular beat pattern induced by astemizole treatment (lower plot, 30 µM). Blue arrows in panel (d) show missed ventricular beats. Videos available in Supplementary Video S1. |

Grade 1 student learning activity addressing NGSS core ideas of the animal body parts needed for survival. (a) Description of NGSS standard and proposed student activity. (b) Timecourse (left, gray image series) shows two motile paramecia (blue and black arrows) in the same field of view as a paralyzed zebrafish larva (shown for scale comparison). Color image at right is a maximum intensity time projection, which plots the brightest pixel from each frame in a timelapse video and thereby marks the trajectory of each paramecium (green). Color was added to this image using the texturizer feature in PowerPoint. (c) Outline for student learning activity comparing swim and prey tracking behavior between a dish containing zebrafish larvae without food (paramecium) versus siblings in the presence of paramecia. (d) Timecourse image series shows zebrafish larva in the absence or presence of paramecia in the petri dish. Note the relative lack of movement in controls (upper, dish 1) in comparison to the paramecia treated dish (lower, dish 2). The timecourse shown in (d) represents 33 ms. (e) Graph shows the difference in the frequency of fish larva (5 dpf) swim behavior between groups proposed in (d). N = 4 larvae per condition obtained in one independent experiment; bars show the mean ± standard error; P = 0.0911, paired two-tailed t-test. (f) Example of student observations comparing groups from panel (d), and proposing the body parts involved in the prey tracking behaviors. Images were acquired using an Apple iPhone 12 Pro with (b) and without (d) the clip-on macro lens. |

Grades 9–12 NGSS student learning activity focused on genetics and inheritance. (a) Description of NGSS standard and proposed student activity. (b) Representative glowscope fluorescence images of 4 dpf Tg(myl7:EGFP) zebrafish larvae used to determine the proportion inheriting the green heart trait (indicated by white arrows). Tabulated data, each set obtained from a single clutch of zebrafish embryos, are matched to Punnett squares that are consistent with the observed offspring phenotypic ratios. Images were acquired using an Apple iPhone 12 Pro. |