
- Title
-
Oxytocin protective effects on zebrafish larvae models of autism-like spectrum disorder
- Authors
- Rahmati-Holasoo, H., Salek Maghsoudi, A., Akbarzade, M., Gholami, M., Shadboorestan, A., Vakhshiteh, F., Armandeh, M., Hassani, S.
- Source
- Full text @ Iran J Basic Med Sci
An overview of the experimental design and endpoints measured in zebrafish larvae exposed to sodium valproate and oxytocin during the experimental period |
Confocal microscope images of larval brains taken at 20x and 40x magnifications in control groups (A and B) and FITC-conjugated oxytocin treatments (C and D). Green spots are the areas that oxytocin has reached |
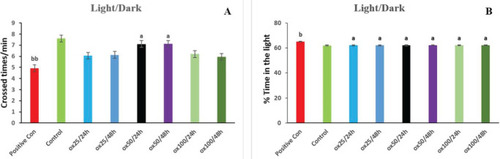
Protective effect of oxytocin in improving social behavior indices in terms of crossed times/min (A) and % of time spent in the light (B) on the Light/Dark background preference behavior. The values are displayed as mean ± SD (n=3). (a) |
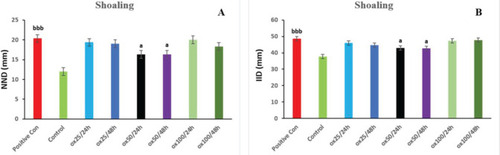
Protective effect of oxytocin in improving social behavior indices in terms of NND (A) and IID (B) on shoaling behavior. The values are displayed as mean ± SD (n=3). (a) |
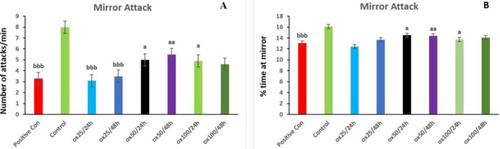
Protective effect of oxytocin in improving social behavior indices in terms of the number of attacks (A) and % of time at mirror (B) on Mirror attack behavior. The values are displayed as mean ± SD (n=3). (a) |

Protective effect of oxytocin in improving social behavior indices in terms of number of contacts/min (A) and % of time in contact (B) on Social contacts test. Values are displayed as mean ± SD (n=3). (a) |
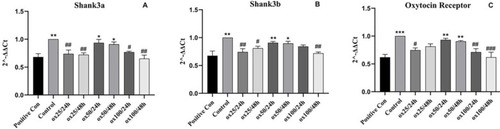
Effect of oxytocin exposure on the expression of genes involved in autism-like behavior in zebrafish larvae. shank3a (A), shank3b (B), and oxytocin receptor (C). The values are provided as mean ± SD (n=3). * |