
- Title
-
A zebrafish HCT116 xenograft model to predict anandamide outcomes on colorectal cancer
- Authors
- Maradonna, F., Fontana, C.M., Sella, F., Giommi, C., Facchinello, N., Rampazzo, C., Caichiolo, M., Hoseinifar, S.H., Dalla Valle, L., Van Doan, H., Carnevali, O.
- Source
- Full text @ Cell Death Dis.

A Representative confocal z-stack images of 5 dpf (3 dpi) larvae with tumor cells marked by the red fluorescence (Dil Vibrant red staining). Scale bar 100 µm. B Quantification of total Dil Vibrant Red fluorescence. The mean value of the tumor size in Ctrl was settled as 100%. The error bar indicates SEM. C Percentage of larvae presenting micrometastasis in the four experimental conditions. (Ctrl n = 66; AEA n = 73; AM251 n = 63; AEA + AM251 n = 69 from five independent experiments). Statistical analysis was performed using one-way ANOVA. *p < 0.01. Image created with Biorender.com. |
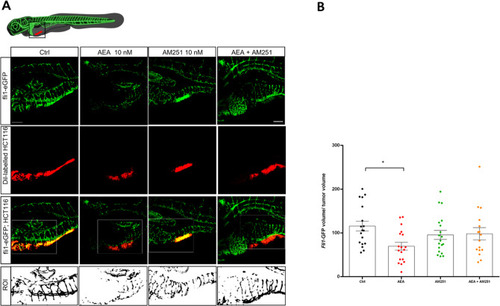
A Representative confocal z-stack images of 5 dpf (3 dpi) larvae with the tumor highlighted by the red fluorescence (Dil Vibrant red staining) and blood vessels marked by the green fluorescence (Tg(fli1:EGFP)y1 line). Scale bar 100 µm. The white box indicates the region of interest (ROI) selected to quantify the vascularization. B Quantification of total green fluorescence of the ROI analyzed with Fiji. The mean value in the Ctrl was settled as 100%. The error bar indicates SEM. Statistical analysis was performed using one-way ANOVA. *p < 0.05; (Ctrl n = 18; AEA n = 18; AM251 n = 19; AEA + AM251 n = 16 from three independent experiments). Image created with Biorender.com. |
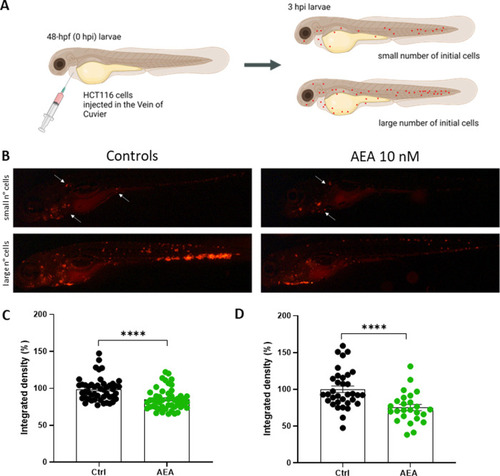
A HCT116 cells were directly injected into the Vein of Cuvier of 48-hpf WT larvae. The image shows the experimental procedure and the division of xenografts considering the number of HCT116 circulating cells 3 hpi. Image created with Biorender.com. B Stereomicroscope Representative Images of 3dpi Ctrl- (on the left) and AEA exposed xenografts (on the right). White arrows pinpoint HCT116 cells in metastasis. C, D Integrated density of HCT116 metastatic tumor cells in 3 dpi zebrafish larvae injected with small (C) and large (D) numbers of cells. The mean value of the integrated density in Ctrl was set as 100%. The error bar indicates SEM. (Small: Ctrl n = 48; AEA n = 50. Large: Ctrl n = 34; AEA n = 25 from three independent experiments). Statistical analysis was performed using Student’s t-test. ****p < 0.0001. |
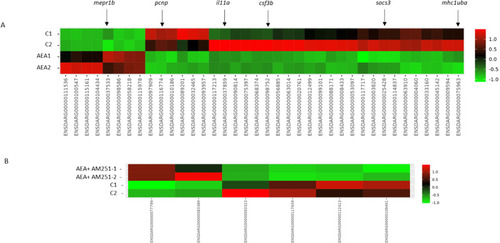
A AEA vs. Ctrl. B AEA + AM251 vs. Ctrl. Color scales represent fold-change between two groups as described (green = downregulation, red = upregulation). Only significant DEGs (FDR < = 0.05) have been included. Arrows show DEGs analyzed in this study. |

Insets show a representative Il6, Vegf-C, Casp3, Lc3A/B, and β-Act Western Blot in the different experimental groups. Densitometric analysis of three independent experiments, a.u. (arbitrary units) a Il6, b Vegf-C, c Lc3A/B, d Casp3. Different letters above each column indicate statistical differences among groups (one-way ANOVA, P < 0.05). |
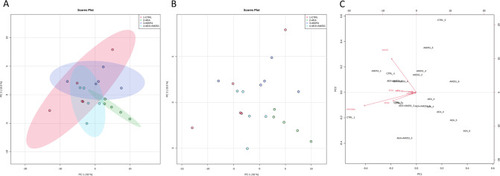
Score plot of Ctrl (red), AEA (green), AM251 (blue), and AEA + AM251 (light blue) A with 95% confidence region or B without 95% confidence region. Axes show scores on PC1 (63%) and PC2 (19.3%). C Biplot shows the loading analysis with a red arrow representing the variables. The bottom and left axes show scores on PC1 and PC2, top and right axes show loading values. |