FIGURE SUMMARY
Title

Topographically localised modulation of tectal cell spatial tuning by complex natural scenes

Authors
Sainsbury, T.T.J., Diana, G., Meyer, M.P.
Source
Full text @ eNeuro

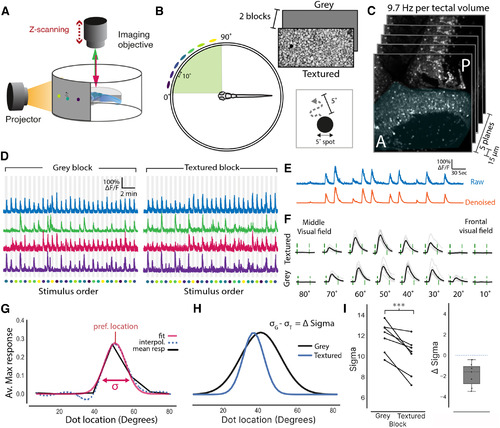
Presenting stimuli over a textured background sharpens the spatial tuning of tectal neurons. A, Schematic of the imaging setup where larvae were head fixed in agarose allowing for visual stimuli to be projected onto a semicylindrical screen while neural activity is monitored via two-photon volumetric imaging. B, A schematic showing that 5° moving dots (virtual prey) were presented at seven different locations along visual azimuth separated by 10°. These dots moved randomly within a 5° neighbored and were presented in two blocks with different backgrounds, gray screen or textured (gravel). A more extensive comparison between the statistics of these two backgrounds is provided in Extended Data Fig. 1-1). C, Imaging volumes of the contralateral tectum (shaded blue) consisted of five optical sections that were taken 15 μm apart at an imaging speed of 9.7 Hz per volume. D, Normalized fluorescence traces from cells that are active in both the gray and textured blocks. Stimulus location is color coded as in B. E, Raw fluorescence traces were denoised to generate smoothed calcium signals. F, Mean responses to each of the stimulus locations (black) and individual repetitions (gray) for an example cell. Stimulus epoch start and end are indicated by the green dashed lines. G, Spatial tuning curves for each cell were calculated by fitting a Gaussian to the interpolated average maximum response to each stimulus location. The preferred stimulus location was taken as the peak and tuning sharpness was taken as the standard deviation (σ) of the Gaussian fit. H, Tuning fits for an example neuron for both the textured and gray backgrounds. From this, a neuron’s change in σ (Δ σ) can be calculated by subtracting its σ value for the gray background (σG) from its σ for the textured background (σT). I, Left, Mean σ values for tectal neurons in both textured and gray blocks. Each connected line represents one fish (n = 7). Sigma was reduced for all fish in the textured block relative to the gray block (paired t test, p < 0.001). Right, A box plot showing the mean change in σ for each fish between the two blocks. Dotted line indicates zero change. This contextual modulation effect was found to be robust to the interpolation method that was used before fitting the Gaussian (Extended Data Fig. 1-2). To ensure that visual responses were not saturated in the these experiments a contrast sensitivity experiment was performed (Extended Data Fig. 1-3); ***p < 0.001.

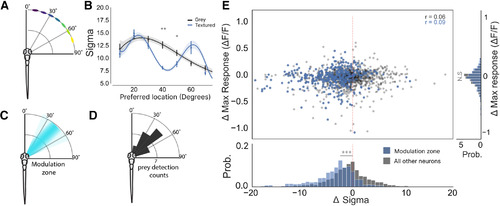
Contextual modulation takes place in a spatially restricted region of visual azimuth. A, A schematic of stimulus location relative to the fish’s body axis. B, A plot of σ against neuron’s preferred stimulus location for each fish, which demonstrates that spatial tuning exhibits contextual sharpening only for stimuli presented between 35° and 50° of visual azimuth (40°: p = 0.02, 50°: p = 0.05, two-way ANOVA, t tests with Bonferroni correction). C, A schematic showing the zone in visual space where contextual modulation occurs. D, This modulation zone corresponds to the area in visual space where hunting routines are preferentially triggered (modified from Romano et al., 2015). E, Top, A scatter plot showing that a neuron’s change in maximum response is not correlated with its change in its σ [modulation zone neurons (blue) Pearson’s r = 0.09; all other tectal cells (dark gray) Pearson’s r = 0.06]. Cells within the modulation zone are highlighted in blue and were defined as cells which had a preferred tuning between 35° and 48°. Right, Histogram showing the difference in Δ max response for neurons within the modulation zone and all other tuned neurons (p = 0.7, t test). Bottom, Histogram showing the difference in Δσ for neurons within the modulation zone and all other tuned neurons (p < 0.001, t test); *p < 0.05, **p < 0.01, ***p < 0.001, N.S = not significant (p > 0.05).

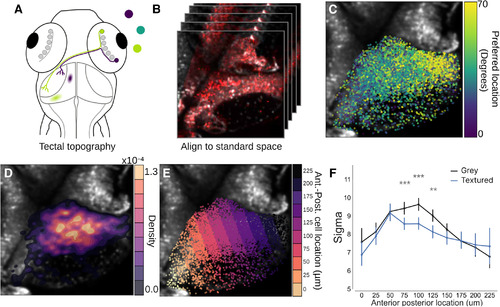
Modulated neurons are topographically distinct within the tectum. A, Schematic detailing the topographic organization of the tectum. Here, retinal ganglion cells project out of the retina and make synapses in the neuropil of the contralateral hemisphere. They do this is a way that preserves a spatial map of visual space within the tectum with frontal visual space mapping onto the anterior portion of the tectum (purple), whereas rear visual space maps more posteriorly (lime green). B, To assess the spatial arrangement of contextually modulated cells in the tectum a standard coordinate space was generated by aligning the functional imaging data to a high resolution stack of the tectum. C, Overlay of cells in the tectum which have been colored by their tuning preference to demonstrate the topography of the tectum. D, Overlay of a density heatmap showing the position of highly contextually modulated cells (Δ σ < −5) within the tectum. E, To quantify the position of contextually modulated cells, the tectum was divided into bins along its anterior-posterior axis. F, A plot of σ values for each segment within the anterior-posterior axis for both textured and gray backgrounds; **p < 0.01, ***p < 0.001.

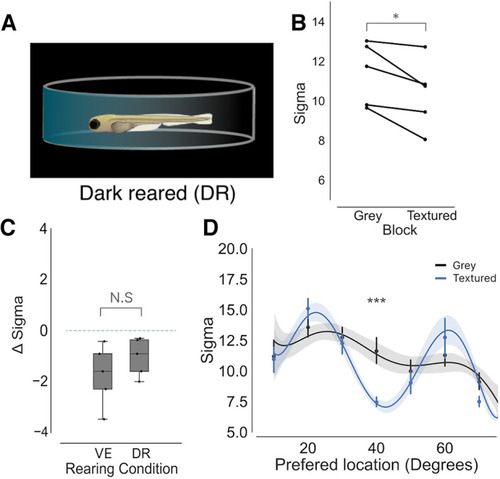
Visual experience has no effect on the development of contextual modulation in the optic tectum. A, To alter the visual environment zebrafish were raised in complete darkness (DR, n = 5). B, Plot mean σ for each DR fish during the gray and textured blocks (p = 0.03, paired t test). C, A boxplot showing Δ σ between background for VE and DR fish (p = 0.1, t test). D, A plot of σ against neuron’s preferred stimulus location for each DR fish. A similar modulation zone to is present around 40° (p < 0.001, t tests, Bonferroni corrected), which is similar to fish raised with visual experience; *p < 0.05, ***p < 0.001, N.S = not significant (p > 0.05).

Acknowledgments
This image is the copyrighted work of the attributed author or publisher, and ZFIN has permission only to display this image to its users. Additional permissions should be obtained from the applicable author or publisher of the image. Full text @ eNeuro