
- Title
-
CLEC16A interacts with retromer and TRIM27, and its loss impairs endosomal trafficking and neurodevelopment
- Authors
- Smits, D.J., Dekker, J., Schot, R., Tabarki, B., Alhashem, A., Demmers, J.A.A., Dekkers, D.H.W., Romito, A., van der Spek, P.J., van Ham, T.J., Bertoli-Avella, A.M., Mancini, G.M.S.
- Source
- Full text @ Hum. Genet.
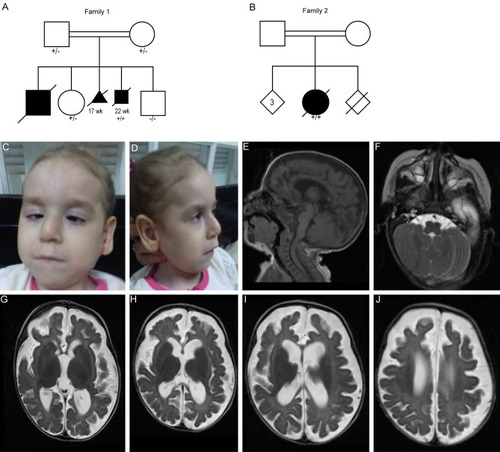
Clinical features and brain MRI of individuals with CLEC16A variants. a, b Pedigrees of the two families with CLEC16A variants. Black boxes represent affected individuals. + / − indicate heterozygous individual, + / + indicates homozygous individual, − / − indicates homozygous WT. Subjects II-1/2 from family 1 presented with similar clinical features as observed in individual II-3 but were not tested for the CLEC16A variant, as there was no DNA available for these siblings. Heterozygosity was confirmed for both parents. c, d Facial features of subject II-1 from family 2. e–j Brain MRI of the affected individual of family 2 made at 3 months of age with midsagittal T1-weighted images (e), and axial T1-weighted images |
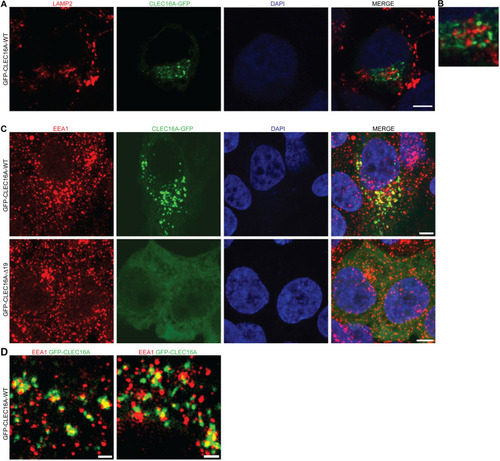
Subcellular localization of CLEC16A-WT and -Δ19. a Immunocytochemistry assessing co-localization of transiently expressed pEGFP-CLEC16A-WT (green) with the late endosomal/lysosomal marker LAMP2 (red). Nuclei were counterstained with DAPI. b Partial zoom of a, showing 3.5 × enlargement. c, d Immunocytochemistry assessing the localization of transiently expressed pEGFP-CLEC16A-WT (green, upper panel) and pEGFP-CLEC16A-Δ19 (lower panel) in HEK293T cells. Cells were stained for the early endosomal marker EEA1 (red). Nuclei were counterstained with DAPI. Overview images were made with confocal microscopy (c) and high-resolution images were with 3D-SIM super-resolution microscopy (d). Two representative images of pEGFP-CLEC16A-WT made with 3D-SIM super-resolution microscopy are shown in d. Scale bars represent 5 µm (a, c) and 1 µm (d) |
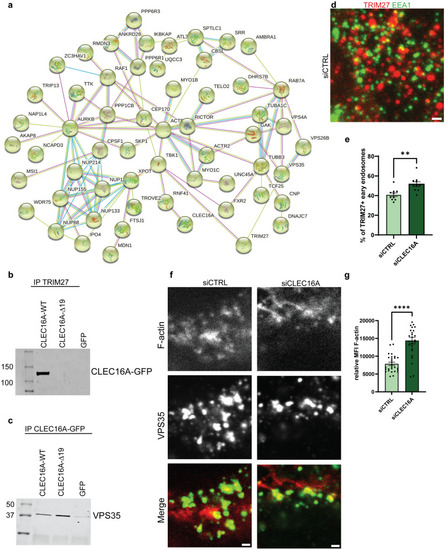
CLEC16A interactome and endosomal F-actin levels. a HEK293T cells were transfected with pEGFP-CLEC16A-WT, pEGFP-CLEC16A-Δ19, or negative control GFP-C1 for 48 h, followed by immunoprecipitation with anti-rabbit GFP antibodies and LC–MS/MS (n = 2 for all groups). Proteins interacting with pEGFP-CLEC16A-WT or pEGFP-CLEC16A-Δ19 but not with GFP-C1 were filtered based on their Andromeda score (> 40). Panel a shows the most significant network, which is related to the retromer complex. The colors of the lines indicate the stringency of the interaction. Light blue: from curated databases, pink: experimentally determined, green: gene neighborhood, red: gene fusions, dark blue: gene co-occurrence, yellow: text miming, black: co-expression, purple: protein homology. b The interaction between pEGFP-CLEC16A-WT/Δ19 was confirmed after reciprocal IP with anti-TRIM antibodies 48 h after overexpression with pEGFP-CLEC16A-WT, pEGFP-CLEC16A-Δ19, or GFP. All plasmids were revealed on immunoblot with anti-GFP antibodies. c The binding of pEGFP-CLEC16A-WT and Δ19 to the retromer component VPS35 was confirmed on immunoblot 48 h after transfection with pEGFP-CLEC16A-WT, pEGFP-CLEC16A-Δ19, or GFP, followed by immunoprecipitation. d Immunostainings on HEK293T cells treated with siCTRL or siCLEC16A siRNAs 48 h after transfection. Cells were stained with antibodies against EEA1 (green) and TRIM27 (red). e Quantification of d, unpaired t test with Welch’s correction (n = 2 experiments; n = 12–15 fields/section, > 150 endosomes per field counted). f Immunostainings on HEK293T cells treated with siCTRL or siCLEC16A siRNAs 72 h after transfection. Cells were stained with antibodies against TRIM27 (green) and phalloidin-alexa 647 (red). g Quantification of f, unpaired t test with Welch’s correction (n = 3 experiments, n = 10 fields/section, 3–5 regions per field analyzed). All scale bars in this Fig. represent 1 µm. **p < 0.01, ****p < 0.0001 |

Quantification of autophagy and mitophagy in clec16a crispants. a Acidic compartments stained with LysoTracker in the clec16a crispants and control injected embryos at 5dpf. Scale bars indicate 50 µm. b Quantification of acidic compartments > 5 µm in the optic tectae of the clec16a crispants brain quantified. Unpaired t test with Welch’s correction (n = 2 experiments, n = 25 fish per group). c LysoTracker staining (magenta) in slc1a2b:Citrine background (green), visualizing radial glia. Scale bars indicate 5 µm (number of fish: n = 12; clec16a crispants n = 13, 2–3 cells per brain were counted, N = 2 experiments). d Quantification of c, unpaired t test with Welch’s correction. e LysoTracker staining (magenta) in mpeg1:GFP background (green), visualizing microglia (n = 11 fish for both groups, 3–4 cells per brain were counted, N = 2 experiments). Scale bars indicate 10 µm. f Quantification of e, Mann–Whitney U test. g, h Single-cell embryos were simultaneously injected with a crRNA targeting clec16a + CLEC16A-WT or CLEC16A-Δ19 mRNA or H2O (number of fish: CLEC16A-WT n = 12, CLEC16A-Δ19 n = 12, H2O n = 11, 2–3 cells per brain were counted, N = 2 experiments). Scale bars indicate 10 µm, one-way Anova. i MitoTracker staining of the right hemisphere midbrain region. j Quantification of i, total high MitoTracker intensity area was quantified in the radial fibers. Scale bars indicate 10 µm (n = 10 fish for both groups, N = 2 experiments, unpaired t test with Welch’s correction). k Intensities of the Parkin protein band were quantified from immunoblot (Supplementary Fig. 7a) and corrected for total protein (Supplementary Fig. 7b). The average relative Parkin abundance of the two control samples was set as a relative abundance of 1 (unpaired t test). *p < 0.05, **p < 0.01, ****p < 0.0001 |
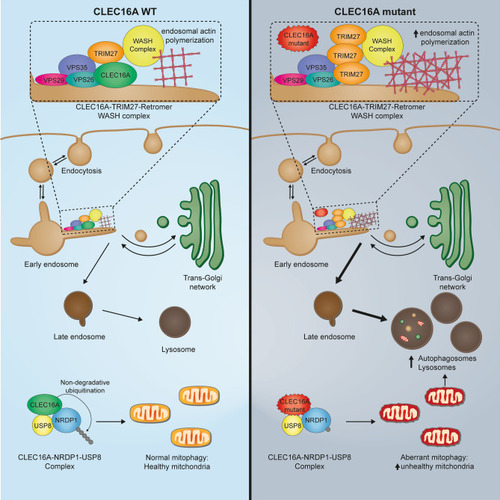
Graphical abstract of CLEC16A interaction with retromer and TRIM27. Left panel shows normal interaction of CLEC16A with early endosome, retromer, and TRIM27. Under physiological conditions, CLEC16A protects from autophagy and regulates mitophagy. Right panel: C-terminus truncated CLEC16A loses interaction with early endosomes, hereby increasing TRIM27 binding to early endosome and F-actin polymerization. CLEC16A dysfunction leads to dysregulated autophagy and accumulation of unhealthy mitochondria |