
- Title
-
Hypoxia deactivates epigenetic feedbacks via enzyme-derived clicking proteolysis-targeting chimeras
- Authors
- Do, T.C., Lau, J.W., Sun, C., Liu, S., Kha, K.T., Lim, S.T., Oon, Y.Y., Kwan, Y.P., Ma, J.J., Mu, Y., Liu, X., Carney, T.J., Wang, X., Xing, B.
- Source
- Full text @ Sci Adv

Illustration of ENCTAC performances under hypoxic condition for selective degradation of BRD4 proteins. |

A) Chemical structure of GSH-responsive CRBN ligand (J266); GSH- and NTR-responsive CRBN ligand (JW4); cleaved J266; CBT-linked BRD4-targeting ligand (JQ1-CBT); click-induced BRD4 degrader (J252). (B) LC-MS spectra of NTR uncaging JW4 (10 μM) to form J266 at different time points in NTR (40 μg/ml) dissolved in phosphate-buffered saline (PBS; 10 mM) (pH 7.4). (C) Selectivity of JW4 toward a broad range of biological and chemical agents with or without NADH. (D) Time-dependent LC-MS spectra of click J252 formation under reducing reagent [tris(2-carboxyethyl)phosphine (TCEP)] that cleave the J266 to induce cleaved J266 before the click reaction with JQ1-CBT in buffer solution. (E) Ratio of peak areas of click J252 and cleaved J266 to J266 over multiple time points in (D). |
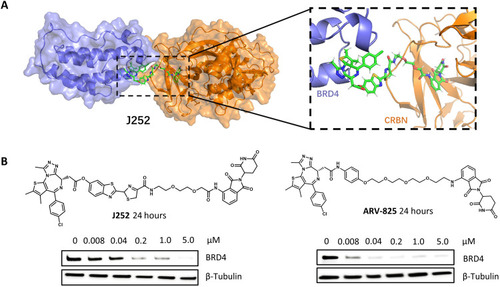
Heterobifunctional degraders efficiently disrupt BRD4 protein. (A) Molecular dynamic simulation of J252 interacting with CRBN (gold) and BRD4 (blue) proteins. The position of the luciferin-based component shows no steric collision with BRD4 or CRBN. (snapshot at 1 ns). (B) Western blot analysis of BRD4 protein after treatment with J252 and ARV-825 in human embryonic kidney (HEK) 293T cells for 24 hours with indicated concentration and β-tubulin as internal controls.
|

Hypoxia-activated degradation of epigenetic BRD4 protein. (A) Illustration of intracellular hypoxic enzyme uncaging, formation of the degrader (click J252), and degradation of BRD4. (B) Western blot analysis of BRD4 protein levels after treatments with GSH-cleavable J266 (6 hours) and JQ1-CBT (12 hours) at indicated concentration and different time points; GSH- and NTR-responsive JW4 (6 hours) with JQ1-CBT (12 hours) at the indicated concentration and for a different time period under hypoxia in HEK-293T cells. (C) Analysis of BRD4 protein levels under the combination of different control conditions for 12 hours (the inhibitor bortezomib incubated with cells for 2 hours before the addition of JW4 and JQ1-CBT). (D) Western blot analysis of BRD4 protein levels after treatments with J266 (6 hours) and JQ1-CBT (12 hours) or JW4 (6 hours) and JQ1-CBT (12 hours) in time- and concentration-dependent examinations of HeLa cancer cells; analysis of BRD4 protein levels after treatments with JQ1 (12 hours) in a concentration-dependent manner of hypoxia HeLa cells; and JW4 (6 hours) and JQ1-CBT (12 hours) in normoxia HeLa cells. (E) Extended concentration of degraders demonstrating the hook effect during incubation under hypoxia (representative results from two to three biological replications). β-Tubulin was used as internal controls. (F) BRD4 degradation level over varied concentration as indicated in (E). Values represent triplicate means ± SD, normalized to nontreated cells, and baseline-corrected using immunoblots.
|
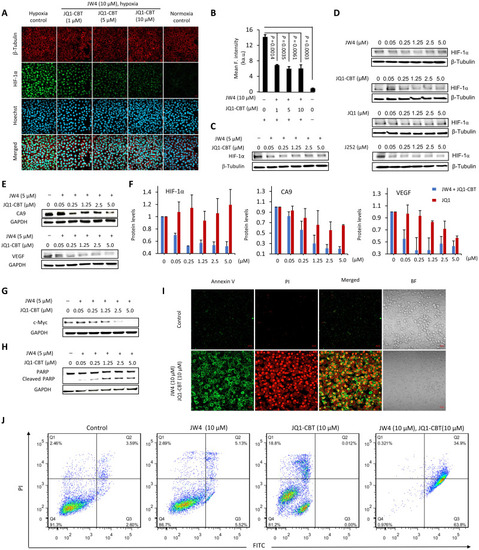
Hypoxic BRD4 degradation resulted in a change in the response of the cellular microenvironment and malfunction of cell growth. (A) Confocal imaging of HIF-1α immunostaining (green; λex = 488 nm and λem = 515/30 nm) after subjecting HeLa cells to the as-stated treatment. Nucleus was stained with Hoechst 33258 (blue; λex = 405 nm and λem = 460/50 nm), β-tubulin was stained with the fluorescent β-tubulin antibody (red; λex = 561 nm and λem = 617/20 nm). Scale bars, 40 μm. (B) Quantitative mean fluorescence intensity of HIF-1α after treatment and staining as indicated in (A). ka.u., kilo–arbitrary units. Values represent mean fluorescence intensity of three different cell areas ± SD. Western blot analysis of HIF-1α after treatment with different concentrations of JW4 and JQ1-CBT (C) or separated JW4, JQ1-CBT, JQ1, and J252 controls (12 hours) (D). (E) Western blot analysis of vascular endothelial growth factor (VEGF) and CA9 after hypoxia-activated ENCTAC treatment (12 hours). (F) Protein level of HIF-1α, VEGF, and CA9 after hypoxia ENCTAC (blue bar) and JQ1 inhibitor treatment (12 hours) (red bar). Values represent the average of duplicates and the range as error bars, normalized to nontreated cells, and baseline-corrected using immunoblots. (G) Immunoblot for c-Myc and glyceraldehyde-3-phosphate dehydrogenase (GAPDH) levels after hypoxia-activated ENCTAC treatment using JW4 and JQ1-CBT for 12 hours. (H) Immunoblot for poly(adenosine 5′-diphosphate–ribose) polymerase (PARP) cleavage and GAPDH levels after similar treatment condition as in (G). (I) Confocal imaging of apoptosis cell death staining with annexin V (AnnV)/propodium iodide (PI) [AnnV (green), λex = 488 nm and λem = 520/30 nm; PI (red), λex = 561 nm and λem = 590/30 nm]. Hypoxic cells without ENCTAC treatment as control. BF, bright field. Scale bars, 40 μm. (J) Flow cytometry of apoptosis/necrosis-stained HeLa cells under treatments with JW4, JQ1-CBT individually, or in combination of JW4 and JQ1-CBT (10 μM) (12 hours). Quarter 1 (Q1) indicates the relative percentage of necrosis cells, Q2 indicates late apoptosis cells, Q3 indicates early apoptosis cells, and Q4 indicates live cells.
|
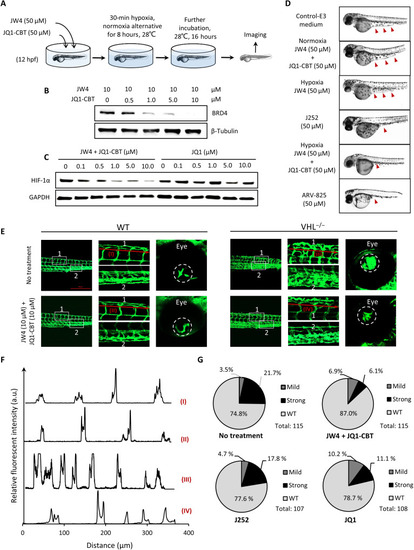
In vivo degradation of BRD4 using ENCTACs to manipulate hypoxic zebrafish development. (A) Scheme of zebrafish early treatment with hypoxia-activated ENCTACs. (B) Western blot analysis of BRD4 level in hypoxia zebrafish after treatment with different concentrations of ENCTAC molecules. (C) Western blot analysis of HIF-1α level in hypoxia zebrafish upon treatment with different concentrations of ENCTAC molecules or with inhibitor JQ1. (D) Bright-field images of zebrafish embryos under different conditions of indicated drug treatment at 36 hpf. Red arrowheads indicate yolk extension area. (E) Fluorescent imaging of zebrafish larvae phenotype with blood vessel trackers (fli1:eGFPy1) in wild-type (WT), and von Hippel–Lindau (vhl) mutant (vhl−/−) larvae with and without ENCTAC treatment. Blood vessel tracker (green), λex = 488 nm and λem = 520/30 nm. Scale bar, 500 μm. (F) Fluorescent intensity spectra of blood vessel alignment along red line (I to IV) indicated in (E). (G) Statistical numbers of vascularization phenotypes in zebrafish larvae with and without ENCTAC treatments or with PROTAC, J252, or inhibitor JQ1 (10 μM).
|
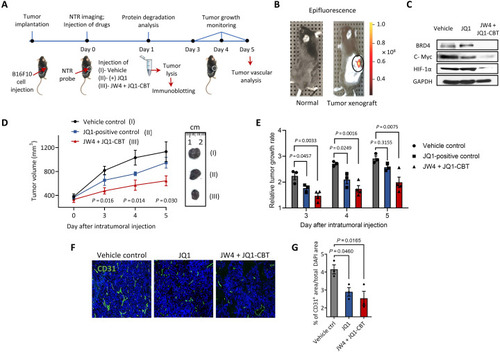
Tumor inhibition by ENCTACs assisted BRD4 degradation. (A) Schematic diagram shows the treatment of ENCTACs in the mouse melanoma xenograft model. (B) Fluorescence image of NTR activity in solid tumor. Near-infrared fluorescence reporter was intratumorally injected, and the image was taken 30 min later. (C) Immunoblot for BRD4, c-Myc, HIF-1α, and GAPDH in tumor lysates collected from mice treated with JW4 and JQ1-CBT (5 mg/kg) mixture, JQ1 (5 mg/kg) alone, or vehicle twice for 4 hours. (D) Representative pictures and quantitative analysis of tumor volume (means ± SD) of vehicle-treated mice (n = 3) or mice treated with JW4, JQ1-CBT mixture (5 mg/kg; n = 4), or JQ1-treated mice (n = 3) for 5 days. (E) Relative tumor growth rate under different treatments as indicated for 5 days. (F) Immunohistochemistry staining with a vascular marker CD31 (green) and nucleus marker 4′,6-diamidino-2-phenylindole (DAPI) (blue) of tumors subjected to ENCTACs, (+)-JQ1, or vehicle control. (G) Quantification of total vascular area in tumors subjected to ENCTACs, (+)-JQ1, or vehicle control.
|
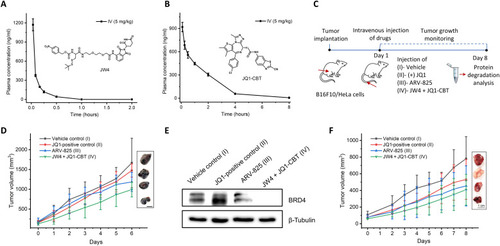
Pharmacokinetic analysis and tumor inhibition studies of ENCTACs. (A and B) Plasma concentration–time profiles of JW4 (A) and JQ1-CBT (X = NH) (B) after intravenous dosing (5 mg/kg). (C) Schematic diagram for the treatment of ENCTACs in the xenograft mouse model with melanoma and HeLa tumor. (D) Representative images and quantitative analysis of tumor volume (means ± SD) of melanoma mice treated with vehicle (n = 4), JQ1 (5 mg/kg, n = 5), ARV-825 (5 mg/kg; n = 5), or JW4 + JQ1-CBT mixture (5 mg/kg; n = 5) for 6 days. (E) Western blot analysis of BRD4 levels in melanoma tumor after intravenous injection of vehicle, JQ1, ARV-825, or JW4 + JQ1-CBT (5 mg/kg). (F) Representative images and quantitative analysis of tumor volume (means ± SD) of HeLa tumor–bearing mice treated with vehicle control (n = 3), JQ1 (5 mg/kg, n = 3), ARV- 825 (5 mg/kg; n = 3), or JW4 + JQ1-CBT mixture (5 mg/kg; n = 3) for 8 days.
|