FIGURE SUMMARY
Title

Comparative single-cell analysis of the adult heart and coronary vasculature

Authors
Balachandran, S., Pozojevic, J., Sreenivasan, V.K.A., Spielmann, M.
Source
Full text @ Mamm. Genome

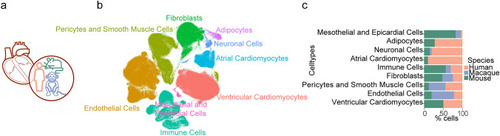
Cell types and composition of adult mammalian hearts.
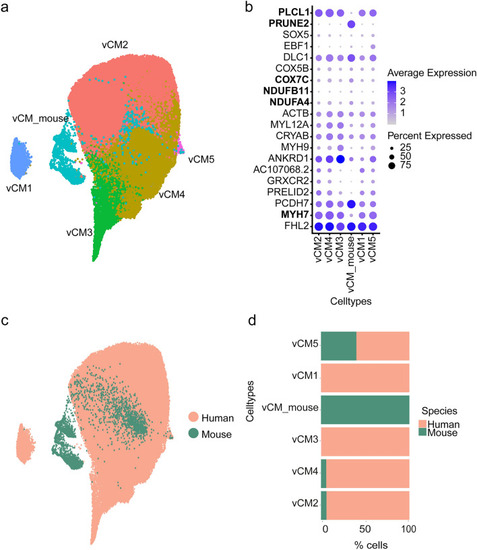
 a Integration of single-cell heart transcriptome data from human, macaque, and mouse. b 2D UMAP embedding of the major cell types after integration. c Percentage contribution of each species to the cells in the major cell types

Ventricular CM. a 2D UMAP embedding of the cell subpopulations of ventricular CM after integrating the cells from the two species. b Dot plot of the cell type-specific marker genes. The key genes showing differential expression between species are written in bold. c 2D UMAP embedding of the integration of the cells from the two species. d Contribution of each species to the percentage of cells in the ventricular CM

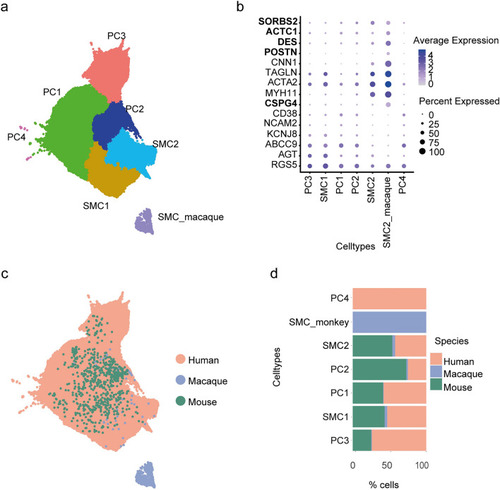
Pericytes and smooth muscle cells.
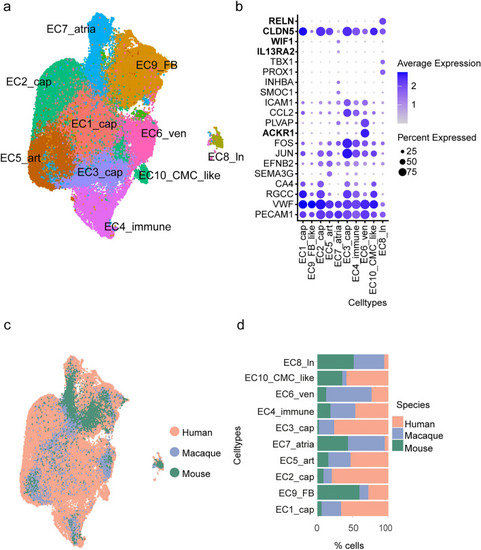
 a 2D UMAP embedding of the cell subpopulations of PC and SMC after integrating the cells from the two species. b Dot plot of the cell type-specific marker genes. c 2D UMAP embedding of the integration of the cells from the three species. d Contribution of each species to the percentage of cells in the PC and smooth muscle cells

Endothelial cells. a 2D UMAP embedding of the cell subpopulations of EC after integrating the cells from the 2 species. b Dot plot of the cell type-specific marker genes. EC_cap—capillary, EC_FB—fibroblast, EC_art—arterial, EC_atria—atrial, EC_ven—venous, EC_CMC_like—cardiomyocyte_like, EC_ln—lymphatic. c 2D UMAP embedding of the integration of the cells from the three species. d Contribution of each species to the percentage of cells in the endothelial cells

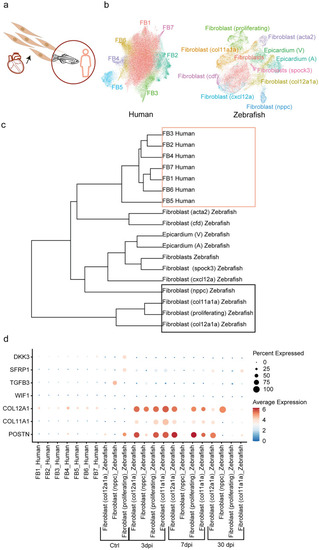
Integration of human and zebrafish cardiac FB. a Single-cell integration of FB of heart datasets from human and zebrafish. b UMAP embedding of the integration of FB from human and zebrafish. c Hierarchical cluster tree analysis of the fibroblast subpopulations. The orange box encircles the populations of the human FB, while the black box encircles the key cell states involved in the regeneration of FB post-injury in zebrafish. d Dotplot representation of the expression of genes essential for regeneration of FB. The expression in zebrafish is split by control and number of days post-injury (dpi)

Acknowledgments
This image is the copyrighted work of the attributed author or publisher, and ZFIN has permission only to display this image to its users. Additional permissions should be obtained from the applicable author or publisher of the image. Full text @ Mamm. Genome