
- Title
-
De novo establishment of circuit modules restores locomotion after spinal cord injury in adult zebrafish
- Authors
- Huang, C.X., Wang, Z., Cheng, J., Zhu, Z., Guan, N.N., Song, J.
- Source
- Full text @ Cell Rep.

Figure 1. Axon regrowth of propriospinal V2a interneurons is highly correlated with locomotion recovery after SCI (A) Illustration of the adult zebrafish spinal cord injury (SCI) model and rhodamine dextran (RD) retrograde labeling of V2a interneuron with regrown axons in Tg(Chx10:GFP). (B) Spinal cord tissue recovery at 2, 4, and 8 weeks post injury (wpi). (C) Left: images of V2a interneurons with regrown axons (GFP+/RD+, arrowheads) at 2, 4, and 8 wpi. Details are enlarged beneath. Right: two-dimensional kernel density analysis of spatial distribution of V2a interneuron with regrown axons along the dorsoventral and mediolateral aspects of the spinal cord. One dot equals one neuron. N = 3 fish and four segments immediately rostral to the lesion were measured in each fish. (D) Quantification of retrogradely labeled propriospinal V2a interneuron numbers in SCI animals at 2, 4, and 8 wpi, and uninjured fish. One dot equals one fish. (E and F) Free and maximum swimming speed of SCI and uninjured animals. One dot equals one fish. (G) Correlation analysis between the number of V2a interneurons with regrown axons, and free or maximum swimming speeds. Values are presented as a percentage of those measured in uninjured fish. All data are presented as mean ± SD. ∗p < 0.05, ∗∗p < 0.01, ∗∗∗p < 0.001, ∗∗∗∗p < 0.0001, significant difference. See also Figure S1 |
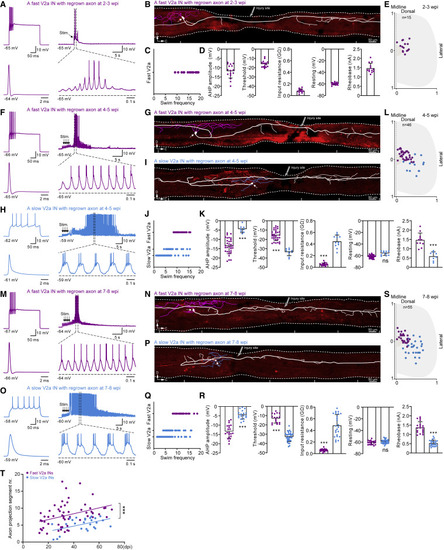
Figure 2. Orderly progression of axon regrowth of fast and slow V2a subpopulations (A, F, and M) A recorded fast V2a interneuron with regrown axons at 2–3/4–5/7–8 wpi displayed a fast-adapting firing pattern and was recruited at high locomotor frequency (>8 Hz). (B, G, and N) Reconstruction of the morphology of the fast V2a interneuron in (A, F, and M) revealed a regrown axon descending across the injury. (H and O) A recorded slow V2a interneuron with regrown axons at 4–5/7–8 wpi displayed a tonic firing pattern and was recruited at low locomotor frequency (<8 Hz). (I and P) Morphology of the slow V2a interneuron in (H and O) revealed a regrown axon descending across the injury site. (C, J, and Q) Distribution of recruited locomotor frequencies of fast (purple) and slow (blue) V2a interneurons with regrown axons at 2–3/4–5/7–8 wpi. (D, K, and R) Population data of after-hyperpolarization (AHP) amplitude, firing threshold, input resistance, resting membrane potential, and rheobase of fast (purple) and slow (blue) V2a interneuron with regrown axons at 2–3/4–5/7–8 wpi. (E, L, and S) Topographical distribution of the somata of fast (purple) and slow (blue) V2a interneurons with regrown axons recorded at 2–3/4–5/7–8 wpi along the dorsoventral and mediolateral aspects of the spinal cord. (T) Axon projection length of fast (purple) and slow (blue) V2a interneurons with regrown axons during the entire recovery period after SCI. Each dot represents one neuron, and only one neuron was recorded from each independent fish. Data are presented as mean ± SD. ∗∗∗p < 0.001, significant difference. See also Figure S2 |

Figure 3. The stepwise restoration of high- and low-rhythm locomotion in SCI animals (A) Drawing of free-swimming monitoring setup and the calculation of tail-beat amplitude. (B and C) Population data of tail-beat frequency and amplitude during free-swimming in SCI animals at 2, 4, and 8 wpi, and in uninjured fish. Ctrl N = 12 fish, n = 37 swimming bouts (SBs); 2 wpi N = 17 fish, n = 39 SBs; 4 wpi N = 16 fish, n = 50 SBs; 8 wpi N = 20 fish, n = 49 SBs. (D) Density distribution of tail-beat frequency during free-swimming. n = 40 SBs (Ctrl), n = 44 SBs (2 wpi), n = 54 SBs (4 wpi), n = 51 SBs (8 wpi). (E) Drawing of forced-swimming control/monitoring setup and design of the behavior assay. (F) Quantification of 20% (black) or 90% (red) maximum speed (MS) for SCI animals at 2 and 8 wpi and uninjured animals. One dot equals one fish. (G–H) Population data of tail-beat frequency and amplitude during forced-swimming at either 20% (black) or 90% (red) MS. Ctrl N = 10 fish, n = 112 (20% MS) or n = 120 (90% MS) SBs; 2 wpi N = 10 fish, n = 117 (20% MS) or n = 102 (90% MS) SBs; 8 wpi N = 11 fish, n = 117 (20% MS) or n = 121 (90% MS) SBs. (I) Density distribution of tail beat frequency during forced-swimming under 20% (black) or 90% (red) MS, respectively. n = 112 (Ctrl 20% MS), n = 121 (Ctrl 20% MS), n = 118 (2 wpi 20% MS), n = 106 (2 wpi 90% MS), n = 119 (8 wpi 20% MS), n = 123 (8 wpi 90% MS) SBs. (J) Illustration of body curvature measurements made using eight markers placed on the long body axis at rest or maximum bending during a single SB. (K) Typical traces of body curvature at maximum bending during forced-swimming cycles at 20% (black) or 90% (red) MS for control and SCI animals. n = 20 (Ctrl 20% MS), n = 21 (Ctrl 20% MS), n = 25 (2 wpi 20% MS), n = 25 (2 wpi 90% MS), n = 18 (8 wpi 20% MS), n = 20 (8 wpi 90% MS) SBs. (L) Principal-component analysis of locomotor pattern during forced-swimming at 20% or 90% MS for SCI animals at 2 wpi (L2) and 8 wpi (L3), and in uninjured ones (L1). Each dot equals one SB from N = 10 (Ctrl), N = 10 (2 wpi), and N = 11 (8 wpi) fish. All data are presented as mean ± SD. ∗p < 0.05, ∗∗p < 0.01, ∗∗∗p < 0.001, ∗∗∗∗p < 0.0001, significant difference. See also Figure S3. |

Figure 4. The orderly reestablishment of fast and slow excitatory V2a circuit modules underlies stepwise restoration of locomotor function (A, E, I, and O) Illustration of paired whole-cell patch-clamp recording between a V2a interneuron rostral to the lesion with regrown axons and a V2a interneuron (A and I) or a motor neuron (E and O) caudal to the lesion. (B, C, F, and G) Paired recordings showing a monosynaptic connection between a rostral fast V2a interneuron and a fast (B) or a slow (C) V2a interneuron or a fast (F) or a slow (G) motor neuron caudal to the lesion at 2–3 wpi. (D and H) Statistical analysis and connectivity matrix of a rostral fast V2a interneuron induced EPSPs in a fast or a slow V2a interneuron (D), or a fast or a slow motor neuron (H) caudal to the lesion at 2–3 wpi. (J and K and P and Q) Paired recordings showing a monosynaptic connection between a rostral fast V2a interneuron with regrown axons and a fast (J) or a slow (K) V2a interneuron or a fast (P) or a slow (Q) motor neuron caudal to the lesion at 7–8 wpi. (M and N and S and T) Paired recordings showing monosynaptic connections between a rostral slow V2a interneuron with regrown axons and a fast (M) or a slow (N) V2a interneuron or a fast (S) or a slow (T) motor neuron caudal to the lesion at 7–8 wpi. (L and R) Statistical analysis and connectivity matrix of a rostral fast/slow V2a interneuron induced EPSPs in a fast or a slow V2a interneuron (L), a fast or a slow motor neuron (R) caudal to the lesion at 7–8 wpi, respectively. (U) Proposed model of the reorganization of intraspinal excitatory circuits dominated by a V2a interneuron with regrown axons that underpins the restoration of locomotor rhythm after SCI. All data shown are mean ± SD. ∗∗∗p < 0.001, significant difference. One dot equals one neuron, and only one pair of neurons was recorded from each fish. See also Figure S4. |
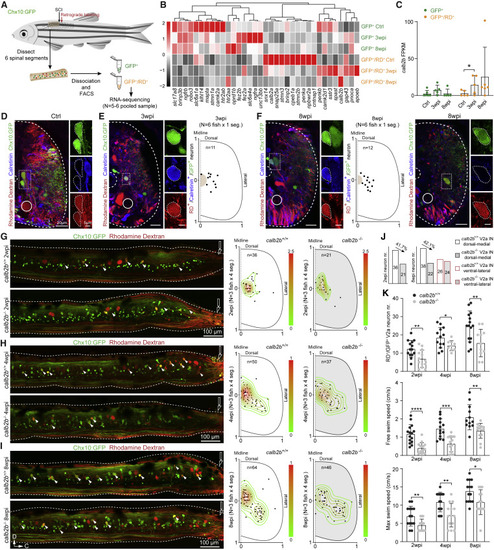
Figure 5. Genetic ablation of calb2b impaired axon regrowth of fast propriospinal V2a interneurons and restoration of fast-speed locomotion (A) Illustration of bulk RNA sequencing procedures. (B) Heatmap of mean FPKM values showing differentially expressed genes associated with axon regrowth and neuron projection. Differential expression analysis was performed either between V2a interneurons with regrown axons (GFP+/RD+) and without regrown axon (GFP+/RD−) at the same time point or between any two SCI time points of GFP+/RD+ using the DESeq2 package (p < 0.05). n = 20 fish for each library, N = 5–6 libraries for each group. (C) Mean FPKM value of calb2b in six groups. ∗p < 0.05. (D) Immunostaining for calretinin in RD retrogradely labeled V2a interneurons in cross-sections of an uninjured Tg(Chx10:GFP) animal. The enlarged cells (dished box), central canal (dashed semicircle), and Mauthner axon (line circle) are indicated. (E) Left: immunostaining of calretinin in V2a interneurons with regrown axons in cross-sections rostral to the lesion at 3 wpi. Right: the somata of V2a interneurons with regrown axons co-labeled with calretinin (GFP+/RD+/calretinin+) displayed a dorsomedial position of the ventral cord. One dot equals one neuron. N = 6 fish and the neurons within the first spinal segment rostral to the lesion were calculated in each fish. (F) Left and middle: co-labeling and distribution of GFP+/RD+/calretinin+ neurons at the dorsomedial position of the ventral cord at 8 wpi. Right: image showing no GFP+/RD+/calretinin+ neurons at the ventrolateral position at 8 wpi. (G–I) Left: RD labeling of propriospinal V2a interneurons with descending axon regrowing over the injury site in calb2b+/+ and calb2b−/− SCI fish of Tg(Chx10:GFP) at 2, 4, and 8 wpi. Right: soma spatial distribution of axon regrown V2a interneuron in calb2b+/+ and calb2b−/− SCI fish at 2, 4, and 8 wpi. (J) Quantification of the dorsomedial (fast) and ventrolateral (slow) subpopulations of V2a interneurons with regrown axons in calb2b+/+ and calb2b−/− SCI fish at 2 or 8 wpi. (K) Quantification of numbers of V2a interneurons with regrown axons (top), and free-swimming speed (middle) and maximum speed (bottom) in calb2b+/+ and calb2b−/− SCI fish at 2, 4, and 8 wpi. One dot equals one fish. All data are presented as mean ± SD. ∗p < 0.05, ∗∗p < 0.01, ∗∗∗p < 0.001, ∗∗∗∗p < 0.0001, significant difference. See also Figures S5 |

Figure 6. Individual physical training facilitated axon regrowth of slow V2a interneurons and accelerated spontaneous locomotor restoration (A) Physical training protocol for SCI animals from 2 to 4 wpi. (B) Quantification of free-swimming speed, maximum-swimming speed, and numbers of V2a interneurons with regrown axons in four spinal segments rostral to the injury site in the training and non-training groups at 4 wpi as well as in the uninjured group. One dot equals one fish. (C) Left: RD labeling of propriospinal V2a interneurons with descending axon regrowing over the injury site in the training and non-training groups at 4 wpi. Right: somata location of propriospinal V2a interneurons with regrown axons along the dorsoventral and mediolateral aspects of the spinal cord in the training and non-training groups at 4 wpi. One dot equals one neuron. N = 3 fish and four segments immediately rostral to the lesion were measured in each fish. All data are presented as mean ± SD. ∗∗p < 0.01, ∗∗∗p < 0.001, ∗∗∗∗p < 0.0001, significant difference. |