
- Title
-
Elucidation of physicochemical properties of polysaccharides extracted from Cordyceps militaris fruiting bodies with different drying treatments and their effects on ulcerative colitis in zebrafish
- Authors
- Wei, Y., Du, X., Guo, Y., Chang, M., Deng, B., Liu, J., Cao, J.
- Source
- Full text @ Front Nutr

Molecular weight profile and surface morphology of the polysaccharides from fruiting bodies of |
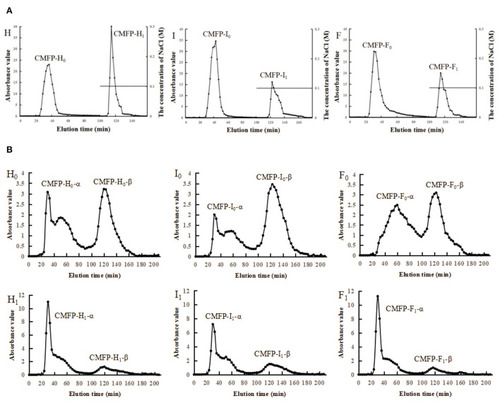
Elution curve of DEAE-52 and Sephacryl S-400 for CMFPs. |

Effect of CMFPs on the histopathological structure (HE staining) of intestinal in inflammatory bowel disease zebrafish. |

Effects of CMFPs on the activities of antioxidant enzymes and immune-related enzymes in the intestine of zebrafish with inflammatory bowel disease at 5 h, 3 d, and 6 d. |
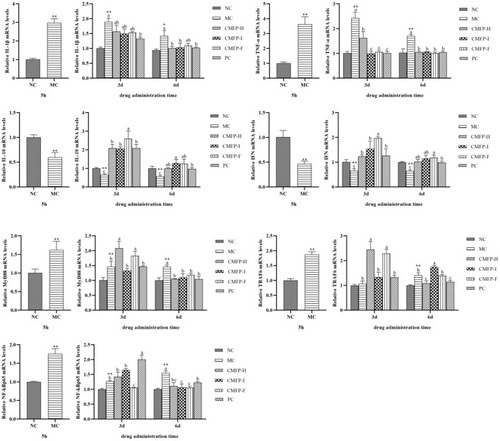
Effect of CMFPs on the expressions of inflammatory cytokines and MyD88/NF-κB Signaling Pathways in the intestine of zebrafish with inflammatory bowel disease at 5 h, 3 d, and 6 d. MC compared with NC, ** |