
- Title
-
Trim33 conditions the lifespan of primitive macrophages and onset of definitive macrophage production
- Authors
- Demy, D.L., Touret, A.L., Lancino, M., Tauzin, M., Capuana, L., Pierre, C., Herbomel, P.
- Source
- Full text @ Development
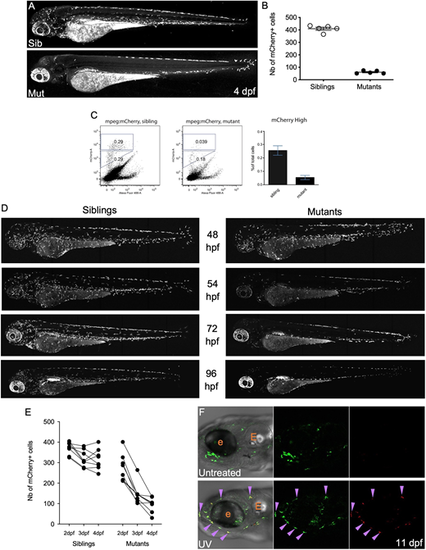
In moonshine mutant zebrafish, primitive macrophages prematurely disappear between 54 hpf and 4 dpf. (A) mCherry+ macrophages in live 4 dpf Tg(mpeg1:mCherry-F) control sibling (top) and monNQ039 mutant (bottom) larvae; maximum projection, lateral view. (B) Quantification of mCherry+ macrophages in live Tg(mpeg1:mCherry-F) sibling (white dots) and monNQ039 mutant (black dots) larvae at 4 dpf (n=5 larvae per condition). Data are mean±s.e.m. (C) Quantification of mCherry+ macrophages from monNQ039/mpeg1:mCherry-F sibling (left plot) and mutant (right plot) larvae at 4 dpf by FACS. Plots provide representative data; graph provides data from a pool of two experiments (mean±s.e.m.). (D) mCherry+ macrophages in live Tg(mfap4:mCherry-F) zebrafish larvae at 48, 54, 72 and 96 hpf in control siblings (left) and monTB222 mutants (right); maximum projection. (E) Quantification of total mCherry+ macrophages in single monTB222/Tg(mfap4:mCherry-F) sibling and mutant larvae followed from 2 to 4 dpf (n=8 larvae per condition). (F) Head region at 11 dpf of Tg(mpeg1:Gal4;UAS:Kaede) larvae: untreated (top) or UV-photoconverted at 2 dpf (bottom); single confocal planes. Purple arrowheads indicate double-positive (i.e. photoconverted) macrophages. e, eye; E, ear. |

Primitive Trim33-deficient macrophages accumulate cytomorphological and metabolic defects before disappearing. (A) Turquoise+ macrophages in the yolk sac of live monTB222/Tg(mfap4:turquoise) control sibling (top) and mutant (bottom) at 3 dpf; maximum projection. (B) Quantification of the roundness of turquoise+ macrophages in live monTB222/Tg(mfap4:turquoise) sibling (left plot, dark grey) and mutant (right plot, light grey) larvae at 3 dpf (n=137 cells from 5 siblings and 79 cells from 3 mutants). ****P<0.0001 Mann–Whitney test. (C) Percentage of turquoise+ macrophages with none, one, two or at least three ramifications in live monTB222/Tg(mfap4:turquoise) sibling and mutant at 3 dpf (n=127 cells from siblings and 86 cells from mutants). Error bars indicate s.e.m. (D) mCherry+ macrophages in the heart region of 3-day-old live monTB222/Tg(mfap4:mCherry-F) control sibling (top) and mutant (bottom); single confocal plane, rostral towards the left. Purple arrowheads indicate macrophages. (E) mCherry+ macrophages in the caudal region of 3-day-old live monTB222/Tg(mfap4:mCherry-F) control sibling (left) and mutant (right), maximum projection, rostral towards the left. Blue asterisk labels a pigment cell. (F,G) Quantification of macrophage fluorescence in live monTB222/Tg(mfap4:mCherry-F) sibling and mutant larvae at 3 dpf, based on (G) fluorescence area (number of fluorescent pixels per macrophage) and (F) total fluorescence (sum of pixel intensities per macrophage); n=10 cells per condition. Data are mean±s.e.m. ****P<0.0001 Mann–Whitney test. (H) Macrophages in the caudal region of 3-day-old live control siblings (top) and monTB222 mutants (bottom) expressing the mfap4:turquoise (macrophages, cyan channel) and mfap4:mCherry-F (macrophage membranes, red channel) transgenes; single confocal plane, rostral towards the left. Purple arrowheads indicate mCherry-F accumulation inside macrophages. (I) Quantification of fluorescence (pixel intensity) along cross-sections of macrophages in mfap4:turquoise/Tg(mfap4:mCherry-F) live sibling (top) and mutant (bottom) at 3 dpf. Black arrowheads indicate membrane-associated mCherry-F signal surrounding the whole-cell turquoise signal in sibling cells. Purple arrowheads indicate mCherry-F intracellular accumulation. Images used for plotting and other examples are shown in Fig. S2. (J) VE-DIC/Nomarski imaging of macrophages in the caudal region of 3-day-old live wild type (top two images) and monNQ039 mutants (bottom four images); rostral towards the left. Purple arrowheads indicate refractile vesicle accumulation inside mutant macrophages. Black arrowheads indicate macrophages in a wild-type sibling. (K) Macrophages in the caudal region of 3-day-old live monTB222 Tg(mfap4:mCherry-F) (macrophages, red channel) stained with LysoID-green (acidic compartments, green channel); control siblings (left) and mutants (right), single plane, lateral views. Purple arrowheads indicate the mCherry-F intracytoplasmic accumulations that also appear to be acidic (LysoID+) and to coincide with the refractile vesicles in mutant macrophages. (L) Bright-field and turquoise fluorescence signal of a dead macrophage in the trunk region of a live monTB222/Tg(mfap4:turquoise) mutant at 72 hpf, single confocal plane, rostral towards the left. (M) Selected time points of an in vivo time-lapse confocal imaging sequence in the caudal region of a monTB222/Tg(mfap4:turquoise) mutant at 72 hpf (rostral towards the left). Yellow arrowheads indicate a macrophage that dies by bursting into apoptotic bodies. y, yolk sac; H, head; h, heart; CA, caudal artery; CHT, caudal hematopoietic tissue; CV, caudal vein; nc, notochord; Nb, number. Scale bars: 50 µm in A,D,E,H,J,K; 10 µm in L. |
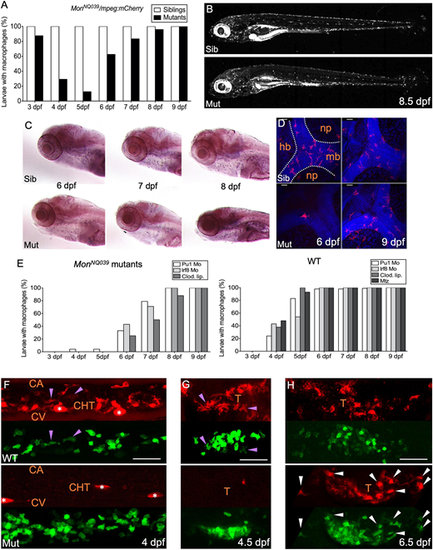
The production of macrophages from definitive hematopoiesis is delayed in moonshine mutants. (A) In vivo quantification of the percentage of sibling and monNQ039 mutant larvae with macrophages from 3 to 9 dpf, using a Tg(mpeg1:mCherry-F) background; n=84 sibling and 24 mutant larvae. (B) mCherry+ macrophages in live 8.5 dpf Tg(mfap4:mCherry-F) control sibling (top) and monTB222 mutant (bottom) larvae; maximum projection. (C) In situ hybridization for whole-mount detection of Csfr1a-expressing cells in control siblings (top) and monNQ039 mutants (bottom) at 6, 7 and 8 dpf. (D) Fluorescent immunodetection of L-plastin+ (leucocytes, red channel) macrophages in the brain of control siblings (top) and monNQ039 mutants (bottom) at 6 (left panels) and 9 (right panels) dpf; maximum projection, dorsal view. Nuclei are stained with Hoechst (blue channel). (E) In vivo quantification from 3 dpf to 9 dpf of the percentage of monNQ039 mutants (left graph) or wild-type controls (right graph) with mCherry+ macrophages under different experimental conditions aimed at removing primitive macrophages: injection of Pu1 MO, Irf8 MO or clodronate liposomes (Clod. Lip.), and metronidazole (Mtz)-mediated ablation in the Tg(mpeg1:Gal4;UAS:NfsB-mCherry) line; n=21 mutant and 88 wild-type larvae. (F-H) Lateral view of the (F) tail region or (G,H) thymus region of wild-type control (top) and mon mutants (bottom) expressing gata2b:Gal4;UAS:LifeAct-eGFP (hemogenic/HSPC-derived cells, green channel) and mpeg1:mCherry-F (macrophages, red channel) transgenes at 4 dpf (F), 4.5 dpf (G) and 6.5 dpf (H); maximum projection. Arrowheads indicate double-positive macrophages in controls (purple) and mutants (white); asterisks indicate pigment cells. Sib, sibling; Mut, mutant; hb, hindbrain; mb, midbrain; np, neuropil; CA, caudal artery; CHT, caudal hematopoietic tissue; CV, caudal vein; T, thymus. Scale bars: 50 µm. |

Trim33 deficiency affects the survival of primitive macrophages and production of definitive macrophages cell-autonomously. (A-C) Lateral view of the caudal regions of parabiotes fused by the head. (A) Wild-type Tg(mpeg1:eGFP-F) control embryo (right) fused to a monTB222/Tg(gata1:Dsred; mfap4:turquoise) sibling embryo (left) at 48 hpf. (B) Wild-type Tg(mpeg1:eGFP-F) control embryo (right) fused to a monTB222/Tg(gata1:Dsred; mfap4:turquoise) mutant embryo (left). Top images show Gata1:DsRed fluorescence in white, on a bright-field background; bottom images show mpeg1:GFP in green, and mfap4:turquoise in magenta. (C) Mutant mfap4:turquoise+ macrophages in the wild-type tail of the parabiosis (left panels) and wild-type mpeg1:eGFP-F+ macrophages in the monTB222 mutant tail of the parabiosis (right panels) at 2, 4 and 5 dpf. Sib, sibling; Mut, mutant. |

Definitive granulopoiesis and thrombopoiesis are boosted in Trim33-deficient mutants. (A) Lateral view of the trunk (left panel) and CHT (right panel) at 5 dpf of control siblings (top) and monNQ039 mutants (bottom) expressing the coro1a:eGFP (leucocytes, green channel) and lyz:DsRed2 (neutrophils, red channel) transgenes. (B) Quantification of neutrophil-associated fluorescence in live monTB222/Tg(mpx:eGFP) siblings and mutants from 5 to 9 dpf, based on total fluorescence (sum of pixel intensities per larva); n=33 mutant and 33 wild-type larvae. Data are mean±s.e.m. (C) Whole-mount Sudan Black staining of mature neutrophils in monNQ039 siblings (top) and mutants (bottom) at 7.5 dpf; lateral view of the kidney area – rostral towards the left. (D,E) Lateral view of the cardiac (D) and caudal (E) regions of 6 dpf live control sibling (left) and mutant (right) larvae expressing the gata1:DsRed (erythrocytes and thrombocytes, red channel) and CD41:eGFP (HSPCs and thrombocytes, green channel) transgenes, pre-treated with BDM to stop the heartbeat prior to imaging. (F) Caudal region of 3 dpf zebrafish Tg(CD41:eGFP) larvae control sibling and mutant larvae. (G) Kidney region of 5 dpf Tg(CD41:eGFP) larvae control sibling and mutant larvae. Sib, sibling; Mut, mutant; k, kidney; sb, swim bladder; h, heart; da, dorsal aorta; av, axial vein; ca, caudal artery; CHT, caudal hematopoietic tissue; cv, caudal vein; nc, notochord; g, gut. Scale bars: 50 µm. |