
- Title
-
WARS1 and SARS1: two tRNA synthetases implicated in autosomal recessive microcephaly
- Authors
- Bögershausen, N., Krawczyk, H.E., Jamra, R.A., Lin, S.J., Yigit, G., Hüning, I., Polo, A.M., Vona, B., Huang, K., Schmidt, J., Altmüller, J., Luppe, J., Platzer, K., Dörgeloh, B.B., Busche, A., Biskup, S., Mendes, M.I., Smith, D.E.C., Salomons, G.S., Zibat, A., Bültmann, E., Nürnberg, P., Spielmann, M., Lemke, J.R., Li, Y., Zenker, M., Varshney, G.K., Hillen, H.S., Kratz, C.P., Wollnik, B.
- Source
- Full text @ Hum. Mutat.
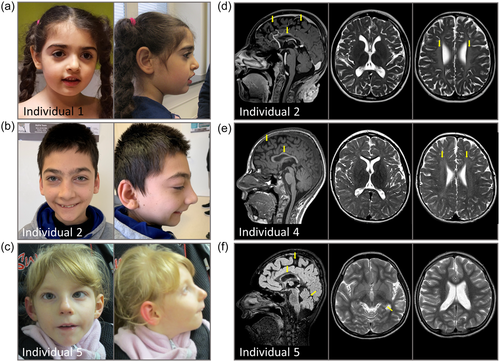
Patient photographs and MRI images. (a) Photographs of individual 1 show no obvious dysmorphism. (b) Photographs of individual 2 with sloping forehead, a large nose with a high nasal bridge, synophrys, long palpebral fissures, and large ear lobes. (c) Photographs of individual 5 with sloping forehead, a long nose with a high nasal bridge, long palpebral fissures, and low-set ears. (d) Cranial MRI of individual 2 showing reduced cerebral volume, consecutively enlarged internal and external cerebrospinal fluid spaces and leukodystrophy. (e) Cranial MRI of individual 4 showing reduced cerebral volume, consecutively enlarged internal and external cerebrospinal fluid spaces and leukodystrophy. (f) Cranial MRI of individual 5 showing reduced cerebral volume and cerebellar atrophy, mesial temporal sclerosis and parahippocampal white matter intensities. Arrows indicate the most prominent brain anomalies. MRI, magnetic resonance imaging.
|

Molecular findings. (a) Pedigree of family 1 and electropherograms showing the homozygous WARS1 variant c.397C>T in individual 1. Both parents are heterozygous carriers. (b) Pedigree of family 2 and electropherograms showing the homozygous WARS1 (NM_004184.4) variant c.397C>T; p.(Arg133Cys) in individuals 2-4. (c) Pedigree of family 3 and electropherograms. Variant c.904C>T; p.(Arg302Cys) in SARS1 (NM_006513.4) is heterozygous in individual 5 and her mother. Variant c.1168C>T; p.(Arg390Cys) is heterozygous in individual 5 and her father. (d) Schematic representation of WARS1 and SARS1 proteins. Localization of the identified variants is indicated with a red arrow. Black arrows indicate the variants previously identified by Musante et al. and Ravel et al. Domain annotation according to Shen et al. (2006) for WARS1 and Xu et al. (2013) for SARS1. One-letter amino acid code is used for clarity. C, Cys; D, Asp; N, Asn; L, Leu; R, Arg.
|
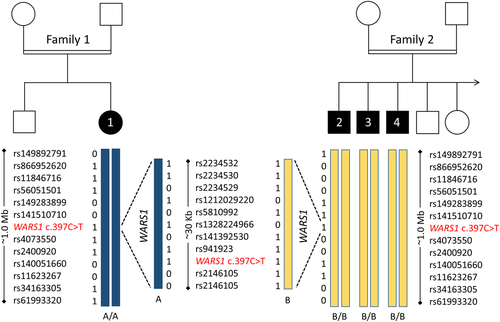
Haplotype analysis. Schematic representation of a ~1 Mb haplotype around the WARS1 locus. Blue boxes represent haplotype A, yellow boxes represent haplotype B. Dashed lines indicate magnification of the ~30 kb WARS1 locus. |
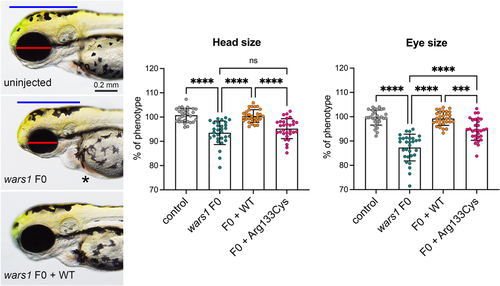
Zebrafish model of wars1 disruption shows microcephaly and supports a loss of function effect of the p.Arg133Cys variant. (a) Zebrafish wars1 knockouts generated by CRISPR/Cas9 technology and analysis of phenotypes in the F0 generation. Uninjected control (left panel), wars1 F0 mutant (middle panel), and wars1 F0 mutant rescue with wild-type human WARS1 mRNA (right panel) embryo at 3 dpf. Blue line indicates brain size. Red line indicates eye size. Black star indicates heart edema. (b) Quantification of head size from uninjected controls, wars1 F0, wars1 F0, and wild-type WARS1 mRNA (+WARS1), and p.Arg133Cys variant WARS1 mRNA. (c) Quantification of eye size from uninjected controls, wars1 F0, wars1 F0, and wild-type WARS1 mRNA (+WARS1), and wars1 F0 and p.Arg133Cys variant WARS1 mRNA. Each group represents ~30 embryos, and each dot shows a single embryo. Error bar = mean ± SD. For statistics, one-way analysis of variance (ANOVA) with Tukey's multiple comparisons test was used: ns, not significant p ≥ .05, **p < .01, ***p < .001, and ****p < .0001. All marked groups were compared to wars1 F0 mutant embryos. mRNA, messenger RNA.
|
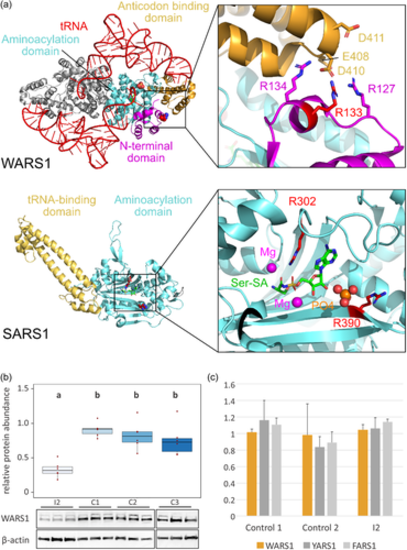
Structural mapping of disease-related variants in WARS1 and SARS1 and functional characterization of the WARS1 variant. (a) Upper panel: structure of the human WARS1 homodimer (PDB 2DR2). Protein and RNA are shown as cartoon. One monomer is colored according to domains as depicted in Figure 2d. The other monomer is shown in grey. The tRNA and Arg133 are shown in red. Arg133 is shown as sphere in the overview. The region containing Arg133 is shown enlarged, with important residues shown as sticks. Lower panel: structure of human SARS1 in complex with Ser-SA (PDB 4L87). The protein is shown as cartoon and domains colored in accordance with Figure 2d. Ser-SA is shown as sticks and Arg302 and Arg390 are shown as red spheres. The active site is shown enlarged with Arg302 and Arg390 shown as sticks and Mg ions and phosphate shown as spheres. (b) Densitometric quantification of WARS1 protein abundance, relative to β-actin loading control, in patient fibroblasts from individual 2 (I2) and three control fibroblasts (C1, C2, C3) (n = 6). Results presented as boxplots (center line represents median, upper and lower hinge show 25th and 75th percentiles, upper and lower whisker extend to largest/smallest value within 1.5× inter-quartile range of the respective hinge, additionally all datapoints are presented individually). Results of ANOVA and post hoc Tukey analysis are presented as compact letter display of all pair-wise comparisons in increasing order. Lower panel: representative WARS1 immunoblots of three replicates each and loading controls (β-actin). (c) Aminoacylation activity was normal in fibroblasts from individual 2 (I2) compared to two control fibroblasts and endogenous activity of aminoacyl tRNA-transferases YARS1 and FARS1. ANOVA, analysis of variance; mRNA, messenger RNA; tRNA, transfer RNA.
|