
- Title
-
Compound heterozygous variations in IARS1 cause recurrent liver failure and growth retardation in a Chinese patient: a case report
- Authors
- Zou, T.T., Sun, H.Q., Zhu, Y., He, T.T., Ling, W.W., Zhu, H.M., Lin, Z.Y., Liu, Y.Y., Liu, S.L., Wang, H., Zhang, X.M.
- Source
- Full text @ BMC Pediatr
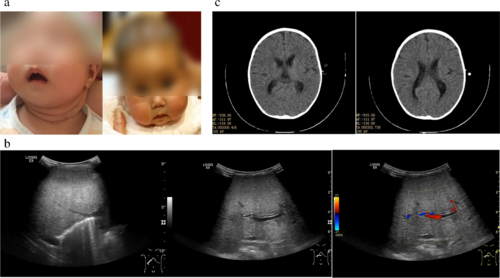
Clinical manifestations. a Face feature. This girl had abnormal fat, round face, and soft translucent skin. b Ultrasound examination. Conventional B-mode ultrasound (left) showed that the liver was significantly enlarged and the echo of the liver parenchyma was coarse, suggesting the possibility of cirrhosis. The B-mode ultrasound (middle) and color Doppler flow imaging (CDFI)(right) showed enlargement of hepatic artery (arrows). c CT scan of brain. The boundary between gray matter and white matter was not clear, the sulci and cistern were slightly widened and deepened, the left lateral ventricle was slightly widened, about 1.0 cm(arrows) |

IARS1 variations and gene structure. a Pedigrees of this family with recessive inherited mutations in IARS1. This patient had two missense variants, and her parents each carried one of the mutations. b Sanger sequencing for these two variations in this family. Left panel is variant c.701 T > C (p.Leu234Pro) (upper) and the normal control at this site (lower); right panel is variant c.1555C > T (p.R519C) (upper) and the normal control at this site (lower). c Structure of IARS1 (NM_002161, NP_002152) with known conserved protein domains in the gene product and localization and conservation of amino acid residues affected by variants identified in this family. Intronic regions are not drawn to scale |

R519C and L234P variants lead to loss of function of the IARS1 gene in the zebrafish model. a High doses of IARS1 and its variant mRNAs (60 pg) produced a high rate of embryonic death and severe embryonic deformities. b, c IARS1 R519C and L234P caused a loss of gene function of IARS1 during zebrafish embryogenesis. IARS1 variations in mRNA failed to impair embryo development (b), myogenesis, neurodevelopment, and liver development (c). Live embryos and fobp1a expression at 3 dpf; sox3 and myod expression at 24 hpf stage, all embryos shown are lateral views anterior to the left. The percentages and numbers indicated in each picture are the ratio of the number (left in bracket) of affected embryos with phenotypes similar to what is shown in the picture and the total number (right in bracket) of observed embryos |