
- Title
-
Golgi-Targeting Fluorescent Probe for Monitoring CO-Releasing Molecule-3 In Vitro and In Vivo
- Authors
- Li, S., Yang, K., Zeng, J., Ding, Y., Cheng, D., He, L.
- Source
- Full text @ ACS Omega

Fluorescence spectra of Golgi-Nap-CORM-3 (10 μM) upon incubation with a series of concentrations of CORM-3 (0, 0.5, 1, 5, 10, 20, 25, 35, 40, 50, 60, 70, and 80 μM, 37 °C) for 60 min. Inset: the curve was plotted with the probe fluorescence intensity (FI) vs CORM-3 concentration. λex = 430 nm. |
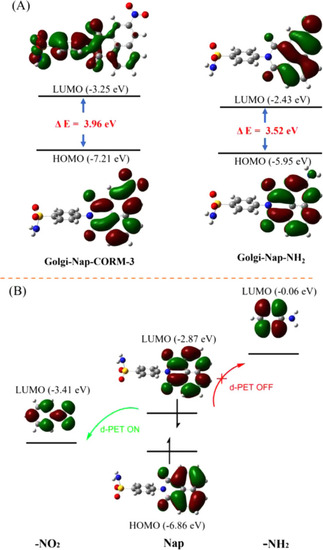
Frontier orbital diagrams of (A) compounds Golgi-Nap-CORM-3 and Golgi-Nap-NH2 and (B) separate naphthalimide, nitro, and amino units. |

Selectivity of Golgi-Nap-CORM-3 (10 μM) toward various analytes (100 μM, except 500 μM Cys, Hcy and 1 mM GSH). (1, Blank; 2, CORM-3; 3, H2O2; 4, •OH; 5, 1O2; 6, ClO–; 7, O2•–; 8, ONOO–; 9, NO; 10, GSH; 11, Cys; 12, Hcy; 13, H2S; 14, Vc; 15, Fe2+; 16, Fe3+; 17, Cu2+; 18, Zn2+; 19, HCO3–; 20, CO32–; and 21, SO42–.) λex = 430 nm. |

Time-dependent intensity of Golgi-Nap-CORM-3 (10 μM) at 520 nm after addition of concentrations of CORM-3 (0, 20, 40, 60, and 80 μM). λex = 430 nm. |

Colocalization fluorescence images of HeLa cells coincubated with Golgi-Nap-CORM-3 (10 μM), CORM-3 (50 μM), and Golgi Tracker Red (500 nM). (a) HeLa cells incubated with CORM-3 for 1 h, followed by treatment with Golgi-Nap-CORM-3 for 1 h in the green channel, λex = 458 nm, collected at 481–580 nm. (b) HeLa cells stained with Golgi Tracker Red (500 nM) for 0.5 h in the red channel, λex = 561 nm, collected at 580–620 nm. (c) Merged image of (a) and (b). (d) Bright-field image. (e) Merged image of (a)–(d). (f) Intensity scatter plot of the green channel and the red channel. Scale bars are 20 μm. |

Confocal fluorescence images of HeLa cells. (a–e) Cells incubated with different concentrations of CORM-3 (0, 20, 40, 60, and 80 μM) for 1 h, followed by treatment with 10 μM Golgi-Nap-CORM-3 for 1 h. (f) Relative FI of (a)–(e). λex = 458 nm, collected at 481–580 nm. Scale bar: 20 μm. |

Confocal fluorescence images of zebrafish. (a) Zebrafish treatment with 10 μM Golgi-Nap-CORM-3 for 1 h. (b) Zebrafish incubated with 80 μM CORM-3 for 1 h, followed by treatment with 10 μM Golgi-Nap-CORM-3 for 1 h. (c) Relative FI of (a) and (b). λex = 458 nm, collected at 481–580 nm. |