
- Title
-
In Vivo Photocontrol of Microtubule Dynamics and Integrity, Migration and Mitosis, by the Potent GFP-Imaging-Compatible Photoswitchable Reagents SBTubA4P and SBTub2M
- Authors
- Gao, L., Meiring, J.C.M., Varady, A., Ruider, I.E., Heise, C., Wranik, M., Velasco, C.D., Taylor, J.A., Terni, B., Weinert, T., Standfuss, J., Cabernard, C.C., Llobet, A., Steinmetz, M.O., Bausch, A.R., Distel, M., Thorn-Seshold, J., Akhmanova, A., Thorn-Seshold, O.
- Source
- Full text @ J. Am. Chem. Soc.
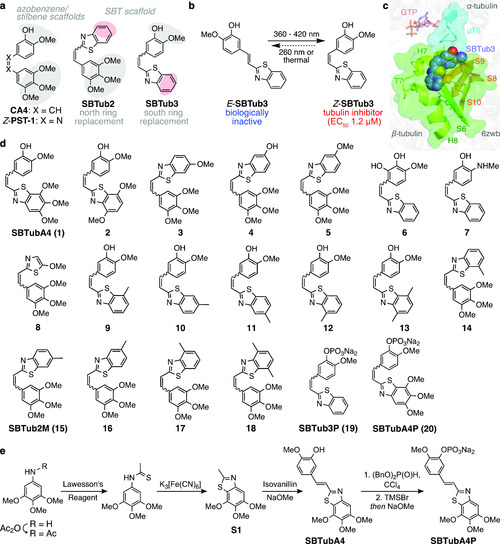
Design and synthesis. (a) The colchicinoid pharmacophore (gray shaded trimethoxyphenyl south ring and isovanillyl north ring) can be applied to various scaffolds, giving photoswitchable azobenzene-based PST and SBT-based SBTub antimitotics. Previously published SBTub2/3 lacked key interaction residues (red shaded sites). (b) Z-SBTub3 inhibits tubulin polymerization and MT-dependent processes. (c) X-ray structure of tubulin:Z-SBTub3 complex (carbons as purple spheres). The south ring is buried in β-tubulin (green); only the north ring interacts with α-tubulin at the α-T5 loop (cyan). (d) Evolved SBTub compound library used in this paper. (e) Typical synthesis of SBTubs proceeds by acetanilide sulfurization, Jacobson cyclization, and basic condensation. Phosphate prodrug SBTubA4P is further accessed by phosphoester formation and deprotection. |
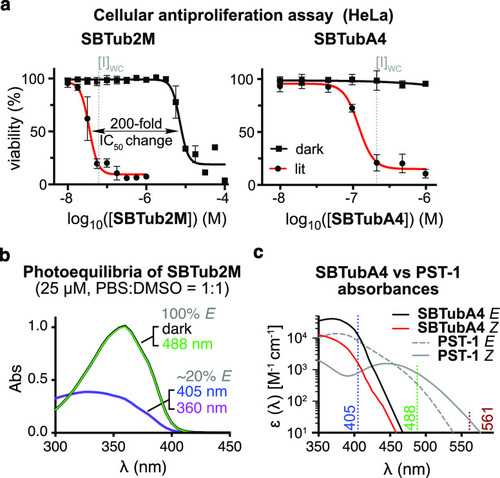
(a) Leads SBTub2M and SBTubA4 have highly nonlinear dose–response profiles, high lit/dark ratio of bioactivity, and mid-nanomolar [I]WC values. (b, c) Photocharacterization: (b) SBTub2M is not isomerized from its all-E dark state by 488 nm illumination, but is photoswitched to majority-Z lit states by UV/violet light (78% Z at 405 nm by NMR; 1:1 phosphate-buffered saline/dimethylsulfoxide, PBS:DMSO). (c) Comparison of absorbance spectra of SBTubA4 and azobenzene PST-1 illustrates the SBT’s ideal match to 405 nm photoactivation, combining stronger 405 nm absorption, with sharper absorption cutoff above 405 nm, which makes it orthogonal to GFP (488 nm), YFP (514 nm), and RFP (561 nm) imaging. |
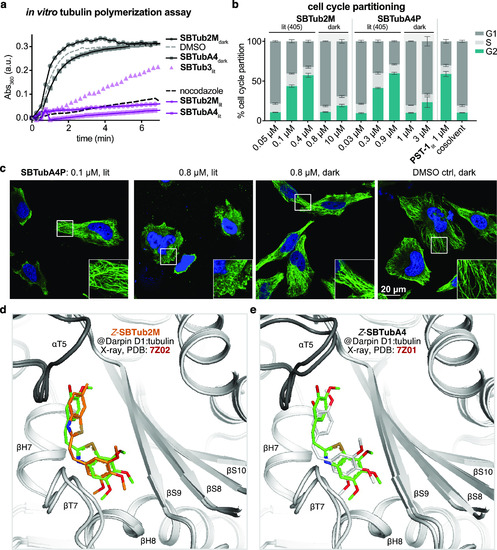
Tubulin-specific cellular mechanism. (a) SBTubs light-dependently inhibit tubulin polymerization (turbidimetric cell-free assay; absorbance mirrors the extent of polymerization; lit indicates majority-Z-SBTub (20 μM) preisomerized to PSS at 405 nm; nocodazole control at 10 μM). (b) Cell cycle analysis of Jurkat cells treated with SBTub2M/SBTubA4P matches photoswitchable reference PST-1: with significant G2/M arrest under 405 nm pulsing (lit), but without cell cycle effects in the dark (matching cosolvent controls). (c) Immunofluorescence imaging of cells treated with SBTubA4P under pulsed 405 nm illuminations (lit, mostly-Z) and in the dark (all-E), compared to cosolvent control (HeLa cells, 20 h incubation; α-tubulin in green, DNA (stained with 4′,6-diamidino-2-phenylindole, DAPI) in blue). (d) Close-up views at the colchicine-binding site of X-ray co-crystal structures (PDB 7Z01, 7Z02) of Z-SBTubA4 (green) and E-SBTub2M (orange) bound to the Darpin D1:tubulin complex (dark gray α-tubulin, light gray β-tubulin in cartoon representation; Z-SBTubA4 and Z-SBTub2M in stick representation, oxygens red, nitrogen blue, and sulfur yellow). (e) Superimposition of tubulin:CA4 (white carbons; PDB 5LYJ) and TD1:Z-SBTubA4 (PDB 7Z01) shows that lead SBTubs share the same binding site as the parent natural product CA4 (see also Figure S11). |

Spatiotemporal control over MT dynamics in 2D-cultured HeLa cells. (a, b) MT inhibition in SBTubA4P-treated cells is initiated only upon 405 nm illumination pulses and only in ROI-targeted cells (data related to Movie S1; live-cell EB3-tdTomato comets quantify polymerizing MTs). (a) Comet count statistics are similar to cosolvent-only baseline in both ROI-pulsed-cosolvent and non-ROI-SBTubA4P conditions; ROI-SBTubA4P statistics show inhibition spikes. (b) Stills from Movie S1 at the times indicated in (a), initially during the untreated timecourse, then during the SBTubA4P-treated timecourse on the same cells. Purple arrowhead indicates the ROI cell; purple dotted circle indicates where the 405 nm ROI is applied at times 26, 88, and 148 s; and white arrowhead indicates the non-ROI cell quantified as the internal control (scale bar 15 μm). (c) EB3 comet counts of cells imaged at 561 nm only (dark, gray), with 47 frames at 487 nm applied to full field of view during the time span indicated with dashed lines (“487”, cyan) and SBTubA4P (6 μM), or with single-frame 405 nm pulses, SBTubA4P (0.6 μM), applied to full field of view at times indicated with dashed lines (“405”, violet) (n = 3 cells). Temporally precise onset and full-field diffusional reversibility are shown (data related to Movies S2 and S3). [(a, c) Mean ± standard error of the mean (SEM) EB3 comet counts as normalized to the means of the first five time points; 405 nm ROIs applied at indicated times; for further details, see the Supporting Information]. |
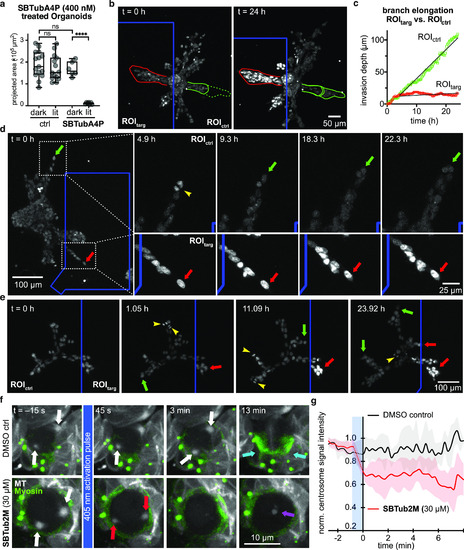
Spatiotemporal control over MT architecture, migration, and mitosis in 3D culture and tissue explant. (a) 3D human mammary gland organoids embedded in collagen gels only have inhibited branch outgrowth when treated with both SBTubA4P and UV pulses. (b) Local applications of UV light to ROItarg regions of SBTubA4P-treated organoids (blue box, one ca. 450 ms pulse per 7 min per z-stack) stops branch proliferation and outgrowth (red outline), while branches in untargeted ROIctrl regions develop dramatically (start: solid green line, final: dotted green line) (related to Movie S4). (c) Radial progress of branch tip fronts (directed and collective behavior) in ROItarg and ROIctrl regions. (d) Still image timecourse, zoomed on a branch tip in the ROIctrl (blue box) region, showing cell proliferation (yellow arrowhead) and matrix invasion (one representative of the migrating cells is tracked over time with green arrows), while branch tip of ROItarg region has static non-proliferating cells and even slight branch retraction (red arrows) (data related to Movie S5). (e) Branch progression and proliferation are unimpeded and continuous in ROIctrl regions, while ROItarg regions are static, and branches growing into the ROItarg stop their growth (color code as in (e), data related to Movie S6). [(a–e) Cell location in organoids tracked with nuclear stain SiR-DNA imaged at 647 nm]. (f) Whole-field-of-view 405 nm photoactivation of SBTub2M-treated intact 3D brain explants of larval Drosophila melanogaster (bottom row) causes neuroblast centrosomes (red arrows) to rapidly shrink in size and signal intensity (45 s and 3 min) and prevents the cell from progressing through division (13 min). Some MT signal accumulates at mid-cell at later time points (purple arrow) (data related to Movie S8). In DMSO-only controls (top row), centrosome integrity (white arrows, 45 s and 3 min) and progression through the cell cycle (13 min) are unaffected, indicated by myosin accumulation at the cleavage furrow (cyan arrows) (data related to Movie S9). [MTs in white (Jupiter::mCherry imaged at 561 nm), myosin in green (Squash::GFP imaged at 488 nm)]. (g) Relative mCherry fluorescence intensity of centrosomal ROIs in SBTub2M-treated prophase neuroblasts (red) after activation at 405 nm drops notably during the approximately 45 s activation period (blue box) compared to the DMSO control prophase neuroblasts (black). Signal intensities are shown as the proportion of the per-cell maximum preactivation signal intensity (shading indicates ±1 standard deviation, 1–2 centrosomes quantified from a total of five neuroblasts from three different animals). For details, see the Supporting Information. |

Photoinhibition of X. tropicalis development, and in vivo photocontrol of MT dynamics in Danio rerio. (a, b) Xenopus embryos incubated with compounds for 1 h at the two-cell stage, before medium exchange optionally with 410 nm photoactivation. Embryos show irreversible development inhibition by in situ formed Z-SBTubA4 in lit conditions but had no effects in the dark or with a low concentration of SBTubA4P [(a) SBTubA4P at 5 μM; (b) development quantified by the ratio of major to minor embryo axis lengths, six embryos per condition, mean ± SEM]. (c) Development of D. rerio treated at the indicated stages for 24 h with SBTubA4P or control compounds under dark or pulsed lit (1 s/5 min) conditions. SBTubA4P (1 or 25 μM) causes morphological abnormalities only in the lit state, showing that it remains effective in vivo. (d, e) Reversible modulation of MT dynamics in 48 hpf zebrafish embryo (25 μM). (EB3-GFP in green, histone H2B in red). (data related to Movies S12–S16; see the Supporting Information). |