
- Title
-
Overexpression of Lifeact-GFP Disrupts F-Actin Organization in Cardiomyocytes and Impairs Cardiac Function
- Authors
- Xu, R., Du, S.
- Source
- Full text @ Front Cell Dev Biol
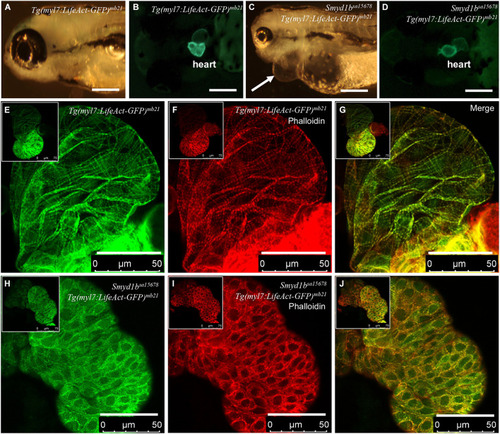
Analysis of congenital cardiomyopathy in smyd1bsa15678 mutant using Tg(myl7:Lifeact-GFP) transgenic zebrafish model. (A–D) Morphology and Lifeact-GFP expression in the heart region of WT Tg(myl7:Lifeact-GFP)mb21 (A,B), and smyd1bsa15678; Tg(myl7:Lifeact-GFP)mb21 mutant (C,D) transgenic larvae at 72 hpf. Pericardial edema is indicated by arrow in smyd1bsa15678; Tg(myl7:Lifeact-GFP)mb21 transgenic mutant larvae (C). Scale bars: 250 μm. (E–J) Actin think filaments in cardiomyocytes revealed by Lifeact-GFP (E,H) and phalloidin staining (F,I) in WT Tg(myl7:Lifeact-GFP)mb21 (E–G), and smyd1bsa15678; Tg(myl7:Lifeact-GFP)mb21 transgenic mutant (H–J) embryos at 72 hpf. (G,J) are merged pictures of (E,F,H,I), respectively. Scale bars: 50 μm. |
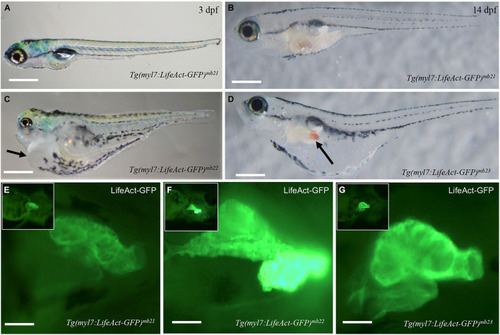
Development of pericardial edema in Tg(myl7:Lifeact-GFP)mb22 and Tg(myl7:Lifeact-GFP)mb23 transgenic embryos. (A–D) Morphology of representative transgenic embryos from Tg(myl7:Lifeact-GFP)mb21 line with no edema (A,B), and Tg(myl7:Lifeact-GFP)mb22 (C), and Tg(myl7:Lifeact-GFP)mb23 (D) transgenic lines with edema phenotypes at 3 (C) and 14 dpf (D), respectively. Pericardial edema is indicated by arrows in Tg(myl7:Lifeact-GFP)mb22 (C), and Tg(myl7:Lifeact-GFP)mb23 (D) transgenic larvae. Scale bars: 500 μm. (E–G) Lifeact-GFP expression in the hearts of Tg(myl7:Lifeact-GFP)mb21 (E), Tg(myl7:Lifeact-GFP)mb22 (F), and Tg(myl7:Lifeact-GFP)mb23 (G) transgenic embryos at 3 dpf. Scale bars: 100 μm. |
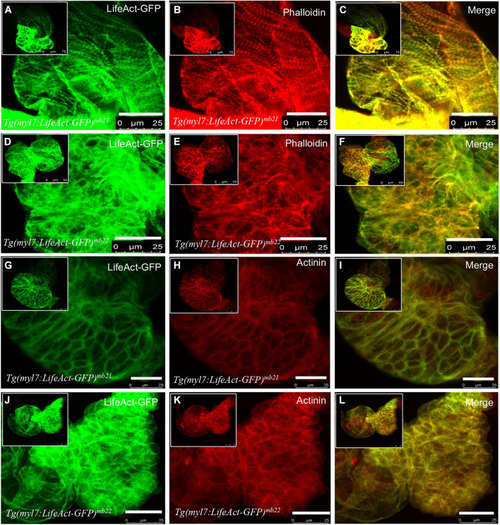
The effect of Lifeact-GFP expression on actin filament and sarcomere organization in cardiomyocytes of Tg(myl7:Lifeact-GFP)mb21 and Tg(myl7:Lifeact-GFP)mb22 transgenic embryos. (A–F) Actin think filaments revealed by Lifeact-GFP (A,D) and phalloidin staining (B,E) in Tg(myl7:Lifeact-GFP)mb21 (A–C), and Tg(myl7:Lifeact-GFP)mb22 (D–F) transgenic embryos at 72 hpf. (C,F) are merged pictures of A-B and D-E, respectively. (G–L) The sarcomeric organization of actin think filament and Z-lines revealed by Lifeact-GFP (G,J) anti-α-actinin antibody staining (H,K) in Tg(myl7:Lifeact-GFP)mb21 (G–I), and Tg(myl7:Lifeact-GFP)mb22 (J–L) transgenic embryos at 72 hpf. (I,L) are merged pictures of (G,H,J,K), respectively. Scale bars: 25 μm. |
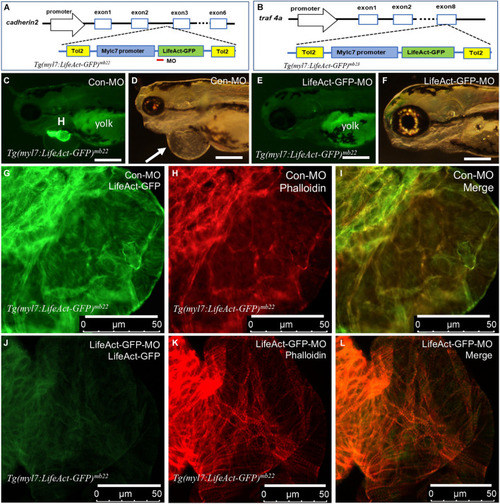
Identification of transgene integration sites in Tg(myl7:Lifeact-GFP)mb22 and Tg(myl7:Lifeact-GFP)mb23 transgenic embryos and the rescue of heart defect by knockdown of Lifeact-GFP expression. (A,B) Mapping the transgene integration sites in Tg(myl7:Lifeact-GFP)mb22 and Tg(myl7:Lifeact-GFP)mb23 transgenic embryos at cadherin2 and traf4a genes, respectively. The Lifeact-GFP-MO is indicated by the red line. (C–F) Morphology of heart region of Tg(myl7:Lifeact-GFP)mb22 transgenic embryos at 72 hpf injected with control-MO (C,D) and Lifeact-GFP-MO (E,F), respectively. Pericardial edema is indicated by the arrow in control-MO injected Tg(myl7:Lifeact-GFP)mb22 (D) transgenic mutant larvae. H, heart; Yolk shows autofluorescence. Scale bars: 250 μm. (G–L) Lifeact-GFP expression (G,J) and phalloidin staining (H,K) showing actin think filaments in cardiomyocytes of Tg(myl7:Lifeact-GFP)mb22 transgenic embryos injected with control-MO (G–I) or Lifeact-GFP-MO (J–L) at 72 hpf transgenic embryos. (I,L) are merged pictures of (G,H,J,K), respectively. Scale bars: 50 μm. |