FIGURE SUMMARY
Title

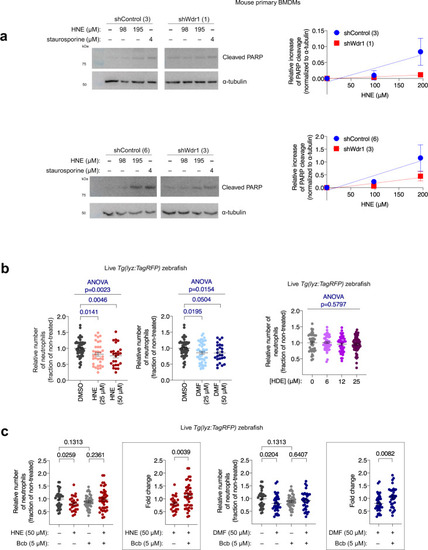
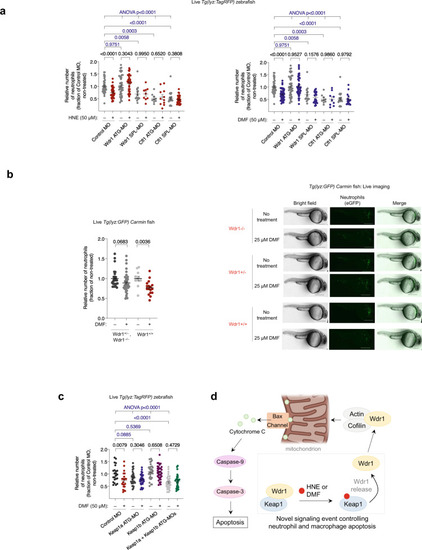
Wdr1 and cofilin are necessary mediators of immune-cell-specific apoptosis triggered by Tecfidera

Authors
Poganik, J.R., Huang, K.T., Parvez, S., Zhao, Y., Raja, S., Long, M.J.C., Aye, Y.
Source
Full text @ Nat. Commun.

Immunity-related genes and neutrophils are suppressed in zebrafish embryos following Keap1-specific hydroxynonenylation.

a Differential expression from RNA sequencing of embryos subjected to Keap1-hydroxynonenylation by Z-REX. Statistically-significant differentially-expressed (SDE) Nrf2-driven AR genes marked with green dots; SDE immunity-related genes with red dots; all other SDE genes with blue dots; and non-SDE genes with gray dots. b qRT-PCR analysis validated suppression of immunity-related genes in zebrafish embryos following Z-REX-assisted Keap1-specific hydroxynonenylation. P values were calculated with ANOVA and Tukey’s multiple comparisons test. c Same as in (a) except Z-REX-mediated modification of Keap1 was executed with a different electrophile, HDE, of similar Keap1-modification efficiency53 and ability to upregulate AR genes [green dots]. Gray dashed lines mark genes not SDE in this comparison. See also Supplementary Table 1 and Supplementary Data 1. d Z-REX-mediated Keap1-hydroxynonenylation, but not Z-REX-technical controls (Supplementary Fig. 1a), caused depletion of neutrophil count in Tg(lyz:TagRFP), in which neutrophils are labeled with TagRFP. Scale bars, 500 μm. e Same as in (d) in fish expressing Halo-P2A-Keap1, which cannot undergo Keap1-hydroxynonenylation by Z-REX (Supplementary Fig. 1a). Scale bars, 500 μm. f Quantitation of neutrophil levels in Tg(lyz:TagRFP) following Z-REX (against all technical controls) using photocaged Z-REX probes, Ht-PreH(D)NE, delivering HN(D)E. Note: signal-to-noise in these experiments (df) is 6:1, so gene expression changes rendering signal below detection levels cannot explain this loss of neutrophils. Tukey’s multiple comparisons test was used to calculate corrected p values. g Similar experiment as in (d) in fish expressing either Halo-TEV-Keap1 or Halo-TEV-Keap1C151S&C273W&C288E (‘Halo-TEV-Keap1 mutant’) which cannot undergo Keap1-hydroxynonenylation. Scale bars, 500 μm. h Quantitation of neutrophil levels in Tg(lyz:TagRFP) following Z-REX using photocaged Z-REX probes, Ht-PreHNE, delivering HNE (d and g). Inset: analysis of fold change (Z-REX/non-treated; see Fig. 2d) in neutrophil count. Note: for Halo-TEV-Keap1 set, the same data are presented in panels (f) and (h) for clarity. P values were calculated with two-tailed Student’s t-test. All data present mean ± SEM. All p values for differential expression in RNA-seq were calculated with CuffDiff. All sample sizes are listed in Supplementary Methods. Source data are provided as a Source data file.

Keap1-hydroxynonenylation-promoted neutrophil loss proceeds via Nrf2-independent apoptosis.

a, b Neutrophil levels were tracked over time following Keap1-hydroxynonenylation by Z-REX (red squares) [against untreated control (blue dots)] in Tg(lyz:TagRFP) expressing either Halo-TEV-Keap1 (a) or Halo-P2A-Keap1 (b). Halo-P2A-Keap1 control construct (Supplementary Fig. 1a inset) cannot undergo Keap1-hydroxynonenylation via Z-REX. P values calculated with Student’s two-tailed t-test. c Whole-mount immunofluorescence (IF) staining of active Caspase-3 (the key apoptotic executioner Caspase) and neutrophils in Tg(lyz:TagRFP) embryos following Keap1-hydroxynonenylation by Z-REX. Scale bars, 500 μm. Box in Merge panel marks the area magnified. White arrows mark colocalizations. d Equation used to calculate fold change (shown in inset panels). This value takes into account the starting number of immune cells and allows a fair comparison between different sets. The value is independent of starting immune-cell count and development. e Keap1-hydroxynonenylation with Z-REX was performed in Tg(lyz:TagRFP) embryos co-injected with control MOs, or MOs targeting Nrf2a or Nrf2b (500 μM). (ATG-MO: an MO targeting the translation start site; SPL-MO: an MO inhibiting splicing). Inset at right: analysis of fold change (Z-REX/non-treated) in neutrophil count. See Supplementary Fig. 5. P values were calculated with ANOVA and Tukey’s multiple comparisons test. f Treatment of Tg(lyz:TagRFP) embryos with two inhibitors of Caspase-3 [AZ-10417808 (reversible, non-peptide) and Z-DEVD-FMK (covalent)] ablated Z-REX promoted neutrophil loss. Inset at right: analysis of fold change (Z-REX/non-treated) in neutrophil count. P values in black were calculated with two-tailed unpaired Student’s t-test; P values in blue were calculated with ANOVA and Dunnett’s multiple comparisons test. g Treatment of Tg(lyz:TagRFP) embryos with Calpain inhibitor I had no effect on Z-REX-promoted neutrophil loss. Inset at right: analysis of fold change (Z-REX/corresponding non-Z-REX-condition) in neutrophil count. P values were calculated with two-tailed unpaired Student’s t-test. h Treatment of Tg(lyz:TagRFP) embryos with Bcb suppressed Z-REX-promoted neutrophil loss. Inset at right: analysis of fold change (Z-REX/corresponding non-Z-REX-condition) in neutrophil count. P values were calculated with two-tailed unpaired Student’s t-test. All data present mean ± SEM. All sample sizes are listed in Supplementary Methods. Source data are provided as a Source data file.

Wdr1 links hydroxynonenylated Keap1 to Bax-dependent apoptosis.

a Keap1-binding partners altered upon Keap1-specific-hydroxynonenylation identified by SILAC proteomics (see Supplementary Table 2, Supplementary Data 2) were knocked down using MOs targeting indicated genes in Tg(lyz:TagRFP), and Z-REX-mediated Keap1-hydroxynonenylation was performed in these knockdown backgrounds. X-axis: effect of the knockdown alone; Y-axis: the fold change in neutrophil count following Z-REX-mediated Keap1-hydroxynonenylation. These effects were not correlated. See Supplementary Fig. 9a, b. b HEK293T transfected with either empty vector or Flag-Wdr1 were treated with staurosporine for 18 h and Caspase-3 activity was measured. P values were calculated with Student’s t-test. c HEK293T transfected with either empty vector or Flag-Wdr1 were treated with staurosporine and/or Bcb for 18 h and Caspase-3 activity was measured. See Supplementary Fig. 11e, f. P values in black were calculated with Student’s t-test; P values in blue were calculated with ANOVA and Dunnett’s multiple comparisons test. d HEK293T subjected to T-REX-mediated Keap1-hydroxynonenylation and staurosporine stimulation showed Caspase-3-activity upregulation; treatment with Bcb ablated this effect. See Supplementary Fig. 11g. P values in black were calculated with Student’s t-test; P values in blue were calculated with ANOVA and Tukey’s multiple comparisons test. e HEK293T cells expressing shWdr1 or shControls were subjected to T-REX-mediated Keap1-hydroxynonenylation in the presence of staurosporine, and Caspase-3 activity was measured. See also Supplementary Fig. 12. P values in black were calculated with Student’s t-test; P values in blue were calculated with ANOVA and Tukey’s multiple comparisons test. f Antioxidant-response (AR) activity was measured in lysates from (e) to evaluate the intersection of Wdr1 with Keap1/Nrf2 signaling. Inset at right: Fold change (T-REX/light alone) in AR. P values were calculated with ANOVA and Tukey’s multiple comparisons test. g Similar experiment as in (e) to measure Caspase-3 activity in HEK293T cells expressing shCfl1 or shControls. See Supplementary Figs. 12 and 15. P values in black were calculated with Student’s t-test; P values in blue were calculated with ANOVA (see also Supplementary Fig. 1b). All data present mean ± SEM. All Student’s t-tests were two-tailed and unpaired. All sample sizes are listed in Supplementary Methods. Source data are provided as a Source data file.

Bulk exposure of mouse primary BMDMs and larval zebrafish to HNE/DMF triggers Bax-dependent macrophage/neutrophil apoptosis.

a Left: western blots analyzing changes in the endogenous levels of cleaved PARP (hallmark of apoptosis) in two different pairs of lentiviral shWdr1-knockdown BMDMs and knockdown-control BMDMs, subsequent to HNE or staurosporine treatment (3 h). Right: ImageJ quantification of relative extent of cleaved PARP in HNE-treated, compared to the respective DMSO-control set, in Wdr1-knockdown BMDMs (red squares) vs. shControl (blue dots) lines. In each dataset, normalization was performed against α-tubulin loading control. Slopes from linear regression of shControl vs. shWdr1, Upper plot: 0.00043 ± 0.00012 and 0.00006 ± 0.00003, respectively. Lower plot: 0.0059 ± 0.0022 and 0.0023 ± 0.0008, respectively. Fits derived from fitting to y = mx. bTg(lyz:TagRFP) embryos expressing Halo-TEV-Keap1 were treated at 30 hpf with HNE or DMF or HDE for 6 h at indicated concentrations (up to maximum tolerable amount prior to cytotoxicity), and then neutrophils were counted. P values were calculated with ANOVA and Dunnett’s multiple comparisons test. Note that for the left two plots, the non-treated data are the same, but are presented in each plot for clarity. c Similar experiment as in (a) except with or without simultaneous administration of Bcb. Inset at right: Fold changes (treated/non-treated) in neutrophil counts. P values were calculated with two-tailed Student’s unpaired t-test. Note that the non-treated data are the same, but are presented in each plot for clarity. All data present mean ± SEM. All sample sizes are listed in Supplementary Methods. Source data are provided as a Source data file.

Bulk exposure of embryos to HNE or DMF triggers Wdr1- and cofilin-dependent apoptosis of neutrophils.

a Similar experiment as in Fig. 4b except Tg(lyz:TagRFP) embryos were injected with Halo-TEV-Keap1 and the indicated MO (500 μM). See also Supplementary Fig. 16. In all cases, embryos were exposed to HNE or DMF at 30 hpf, and neutrophils were counted at 36 hpf. Inset at right: Fold changes (treated/non-treated) in neutrophil counts in each knockdown background. P values in black were calculated with two-tailed unpaired Student’s t-test. P values in blue were calculated with ANOVA and Dunnett’s multiple comparisons test (see also Supplementary Fig. 1b). Note that the non-treated data sets in each plot are the same, but presented in each plot for clarity. bTg(lyz:eGFP) carmin embryos were treated at 30 hpf with DMF for 4 h, and neutrophils were counted subsequently. See also Supplementary Fig. 18a–d. Scale bars, 500 μm. Inset: analysis of fold change (DMF/non-treated) (see Fig. 2d) in neutrophil count. P values were calculated with two-tailed unpaired Student’s t-test (Supplementary Fig. 1b). c g(lyz:TagRFP) embryos were injected with MOs targeting Keap1a, Keap1b, both, or control MO (500 μM). See also Supplementary Fig. 19. At 30 hpf, embryos were treated with DMF for 6 h, then neutrophils were counted. P values in black were calculated with two-tailed unpaired Student’s t-test. P values in blue were calculated with ANOVA and Dunnett’s multiple comparisons test (see also Supplementary Fig. 1b). d Model of the Keap1-modification-specific apoptotic axis necessary for DMF mode-of-action in immune-cell depletion. Upon Keap1-electrophile-modification, Wdr1 is released from Keap1 binding. In concert with cofilin, Wdr1 promotes Bax-dependent mitochondrial-targeted activation of Caspase-3. All data present mean ± SEM. All sample sizes are listed in Supplementary Methods. Source data are provided as a Source data file.

Acknowledgments
This image is the copyrighted work of the attributed author or publisher, and ZFIN has permission only to display this image to its users. Additional permissions should be obtained from the applicable author or publisher of the image. Full text @ Nat. Commun.