
- Title
-
Protective Effects of Sal B on Oxidative Stress-Induced Aging by Regulating the Keap1/Nrf2 Signaling Pathway in Zebrafish
- Authors
- Li, E., Wang, Y., Li, Q., Li, L., Wei, L.
- Source
- Full text @ Molecules
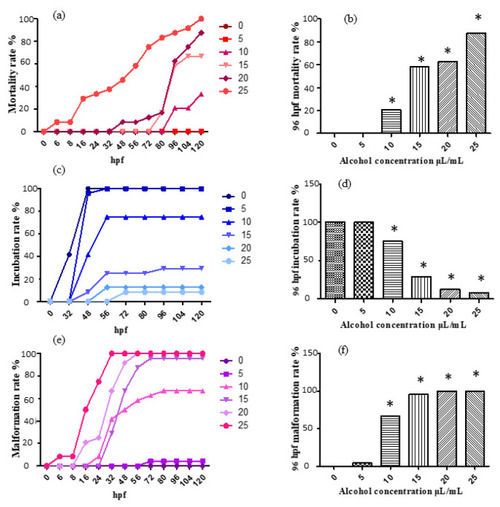
The mortality rate, incubation rate and malformation rate after ethanol treatment. The results were analyzed by ?2 test, vs. the control group (0 ?L/mL ethanol): * p < 0.05. (a) mortality rate; (b) mortality rate at 96 hpf; (c) incubation rate; (d) incubation rate at 96 hpf; (e) malformation rate; (f) malformation rate at 96 hpf. |

The various malformation after being ethanol-treated. (a) normal; (b,c) pericardial edema, yolk sac deformity and spinal curvature; (d) pericardial edema; (e) heart bleeding; (f) liver bleeding. |
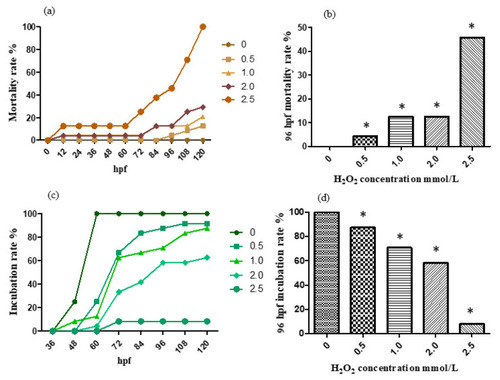
The mortality rate (a,b) and incubation rate (c,d) after being H2O2-treated. The results were analyzed by ?2 test, vs. the control group (0 ?L/mL ethanol): * p < 0.05. |
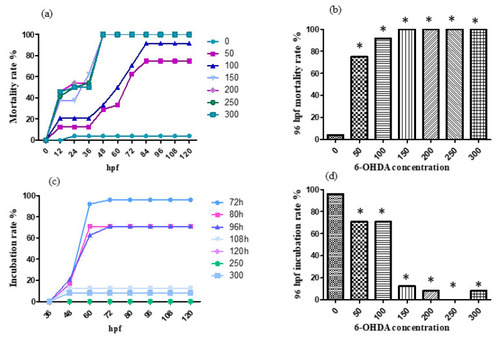
The mortality rate (a,b) and incubation rate (c,d) after being 6-OHDA-treated (at a high concentration). The results were analyzed by ?2 test, vs. the control group (0 ?L/mL ethanol): * p < 0.05. |
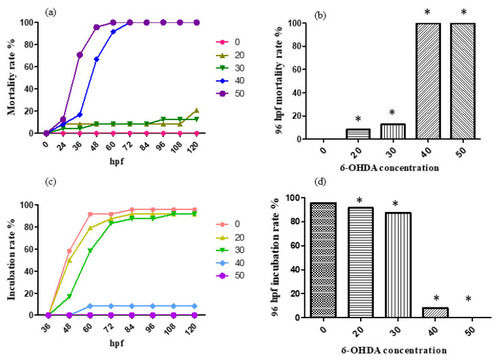
The mortality rate (a,b)and incubation rate (c,d) after being 6-OHDA-treated (at a low concentration, 0?50 ?mol/L). * p < 0.05. |
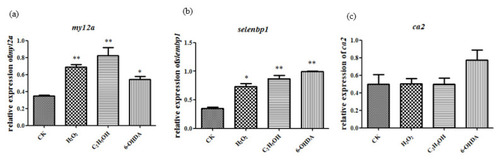
Ethanol, H2O2 and 6-OHDA promote the expression of myl2a (a), selenbp1 (b) and ca2 (c). The statistical results shown represent the means (n = 3); vs. the control group (n = 3) * p < 0.05, ** p < 0.01. |
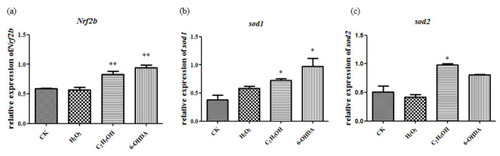
Ethanol, H2O2 and 6-OHDA promote the expression of Nrf2b (a), sod1 (b) and sod2 (c). The statistical results shown represent the means (n = 3); vs. the control group * p < 0.05, ** p < 0.01. |
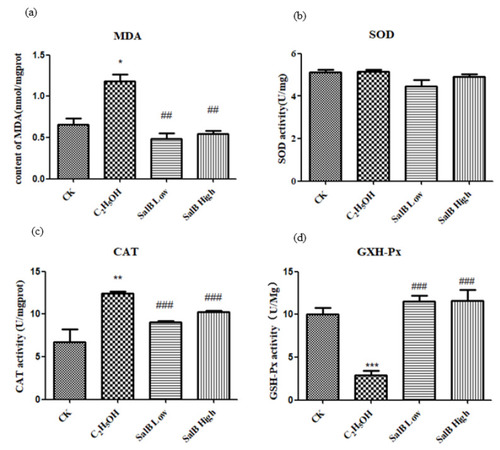
Salvianolic acid can inhibit oxidative stress caused by ethanol. (a) The content changes of MDA increased after adding ethanol; (b) SOD activity did not change; (c) CAT activity increased; (d) GXH-Px activity decreased. The statistical results shown represent the means (n = 3); vs. the control group (n = 3) * p < 0.05, ** p < 0.01. vs. the ethanol-treated group # p < 0.05, ## p < 0.01, ### p < 0.001. |
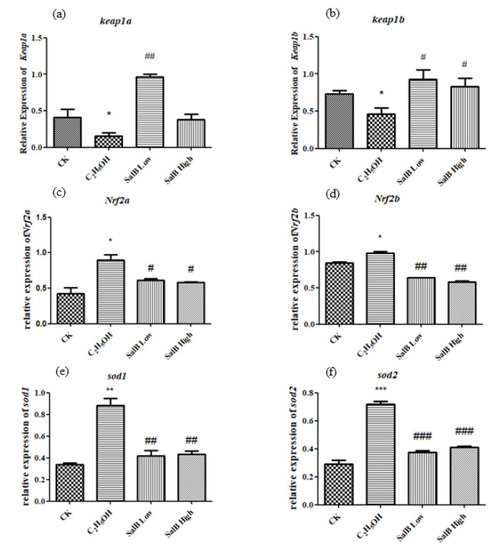
The expression of keap1a (a), keap1b (b), Nrf2a (c), Nrf2b (d), sod1 (e) and sod2 (f) after Sal B was added in the group of ethanol acute toxicity treatment. The statistical results shown represent the means (n = 3); vs. the control group (n = 3) * p < 0.05, ** p < 0.01, *** p < 0.001 vs. the ethanol-treated group # p < 0.05, ## p < 0.01, ### p < 0.001. |
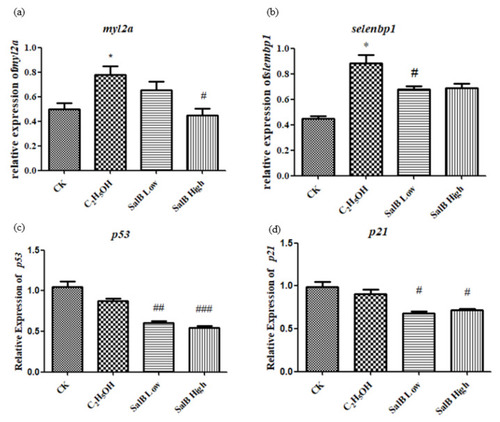
The expression of myl2a (a), selenbp1 (b), p53 (c) and p21 (d) after Sal B added in the group of ethanol acute toxicity treatment. The statistical results shown represent the means (n = 3); vs. the control group (n = 3) * p < 0.05, ** p < 0.01, *** p < 0.001 vs. the ethanol-treated group (n = 3) # p < 0.05, ## p < 0.01, ### p < 0.001. |
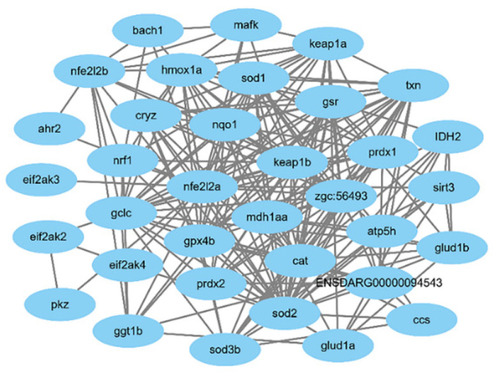
The protein?protein interactions of oxidative-related genes. |